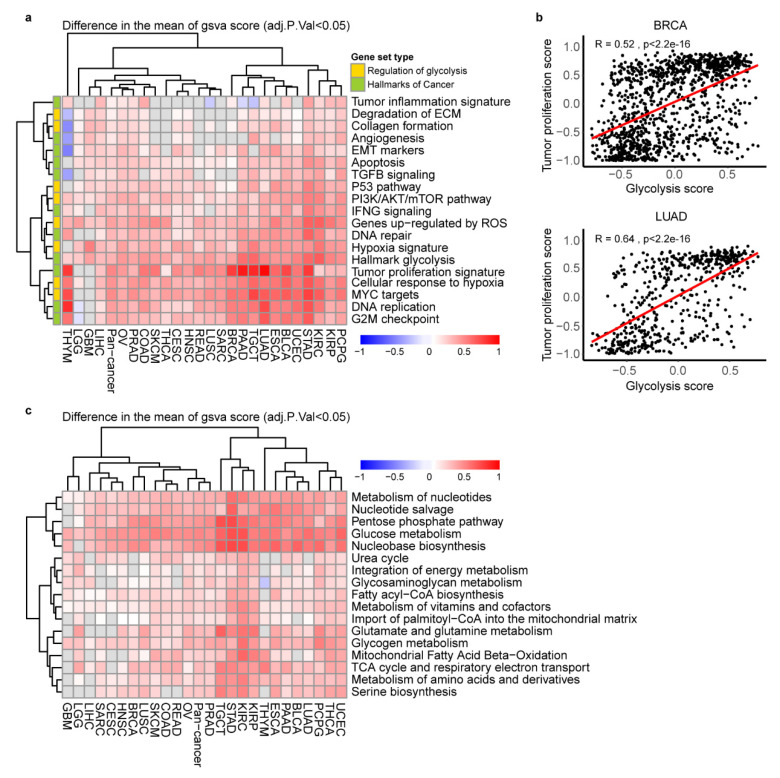
Figure 3.
Association of glycolysis score with cancer hallmarks and metabolic reprogramming. (a). Heatmap showing the difference of GSVA scores of cancer hallmarks signatures enriched in the high glycolysis versus low tumors. adj.p < 0.05. (b). The Spearman correlation between tumor proliferation signatures and glycolysis score in BRCA and LUAD, p < 0.05. (c). Heatmap showing the difference of gene set variation (GSVA) scores of cancer metabolic reprogramming signatures enriched in the high glycolysis versus low tumors. adj.p < 0.05.

