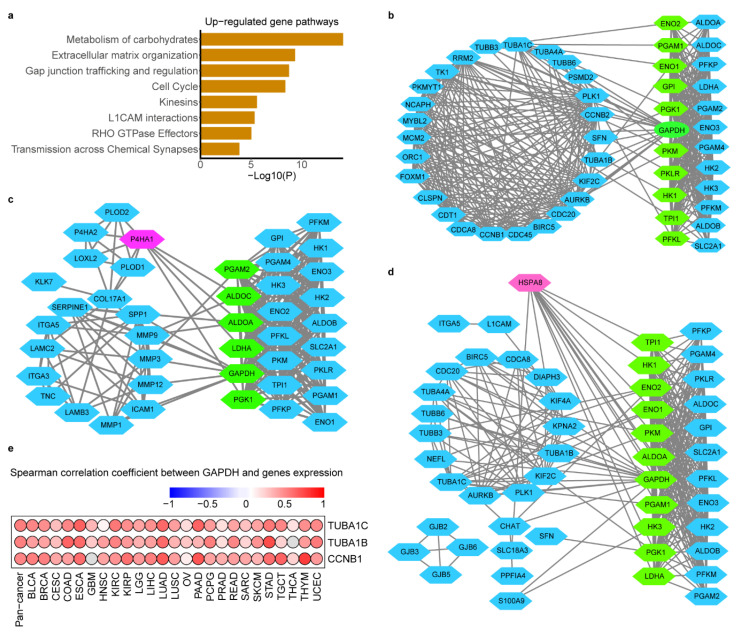
Figure 5.
Glycolysis-associated mRNA and pathway signatures in hypoxia microenvironment. (a). Reactome pathway enrichment of genes that were up-regulated in the glycolysis high tumors in at least 13 cancers. p < 10-2. b-d. Protein interaction network between genes in cell cycle (b), ECM remodeling (c) and Gap junking (d) with glycolysis genes. Blue nodes in left represent DEGs and blue nodes in right represent the glycolysis genes, green nodes represent key genes in glycolysis which mostly linked with DEGs and red nodes represent the genes with most linking with glycolysis genes. (e). Spearman correlation between tumor GADPH and most glycolysis-related genes TUBA1C, TUBA1B and CCNB1 in cell cycle across cancer types.

