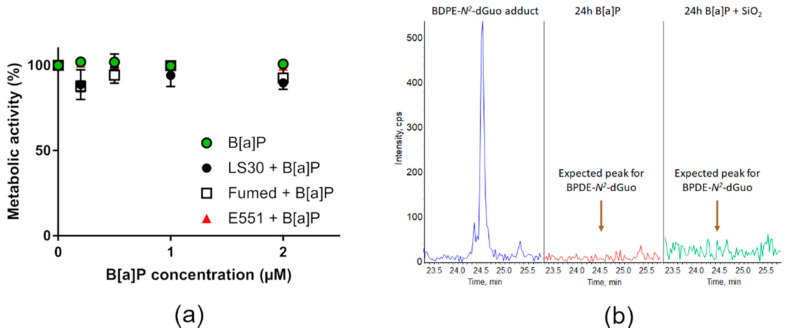
Figure 6.
Cyto- and genotoxicity of B[a]P or SiO2 co-exposed with B[a]P towards RAW264.7 cells. (a) Cell metabolic activity, assessed via the WST1 assay; (b) HPLC-MS/MS chromatograms obtained upon quantification of BPDE adduct to DNA showing the expected position of the BPDE adduct peak (BPDE-N2-dGuo) (blue, left), of DNA extracted from cells exposed to 2 µM B[a]P (red, middle) and of DNA extracted from cells exposed to 2 µM B[a]P and 10 µg/mL Fumed SiO2 (green, right).

