Figure 6.
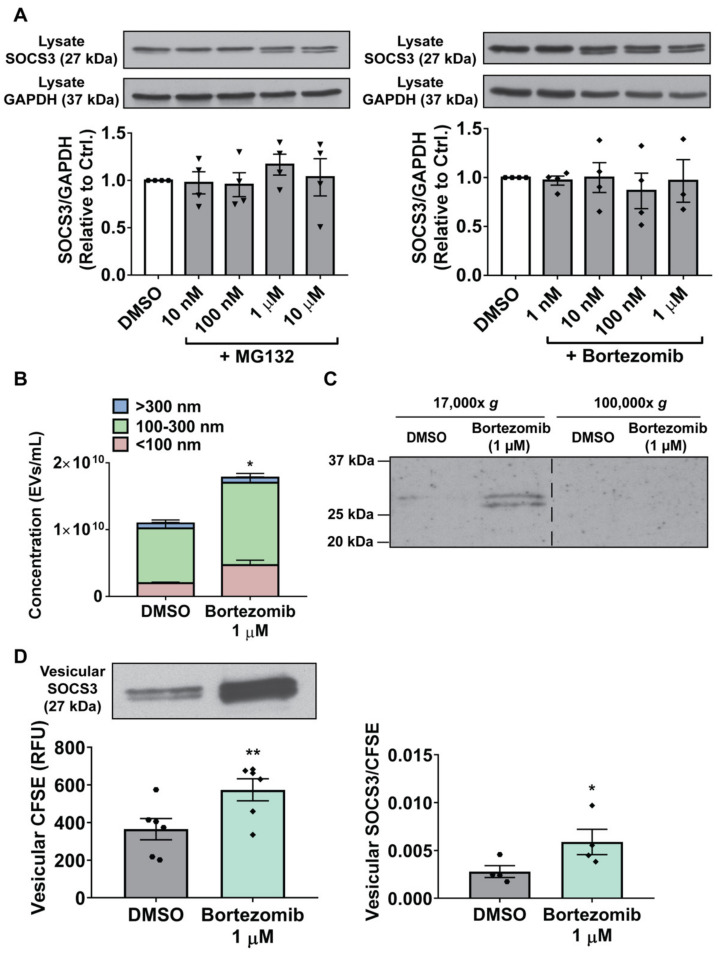
Inactivation of the proteasome potentiates MH-S cell production of EVs and packaging of vesicular SOCS3. (A–B) Adherent MH-S cells were treated for 20 h with specified concentrations of MG132 or bortezomib. (A) Lysates were collected and SOCS3 expression was assessed by Western blot, with GAPDH as a loading control. Densitometry data (mean ± SEM) are from ≥3 independent experiments, and significance analyzed by one-way ANOVA. (B) EVs were collected by 100-kDa centrifugal filtration, diluted in PBS, and quantified by NTA. Data (mean ± SEM) are from >3 independent experiments in which ≥3 capture periods (60 s) were analyzed for each sample. Significance was determined using paired sample t-test. (C) EVs were isolated by sequential ultracentrifugation of CM at 17,000× g and 100,000× g to pellet lEVs and sEVs, respectively, and probed for SOCS3 via Western blot. Dashed line indicates splicing of discontinuous lanes from the same blot. Data are from 1 experiment representative of 3 independent experiments. (D) Prior to stimulation with bortezomib, MH-S cells were labeled with CFSE. Unlabeled cells were also treated with bortezomib in parallel for measuring secretion of vesicular SOCS3. Following treatment, wash, and culture of cells for 20 h, vesicular fraction samples were concentrated via 100-kDa centrifugal filtration and either probed for SOCS3 via Western blot (left panel, top) or CFSE fluorescence (left panel, bottom). SOCS3 packaging was then measured, as described in “Experimental procedures” (right panel). Data (mean ± SEM) are from >3 independent experiments, and significance analyzed using paired sample t-test. DMSO = DMSO control. * and **, p < 0.05 and p < 0.01, respectively vs. DMSO control. “Hexagons” indicate data points for DMSO samples, “inverted triangles” indicate data points for MG132 samples, and “diamonds” indicate data points for bortezomib samples.

