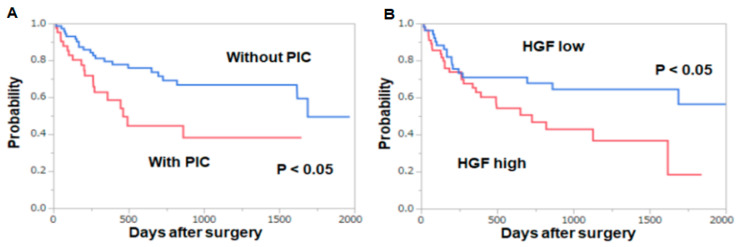
Figure 2.
Overall survival after esophagectomy. (A) Comparison between the patients with and without PICs (B) Comparison between the patients whose HGF levels on POD 3 were three times or more higher than the preoperative values and of those less than three times higher. Survival rates were calculated using the Kaplan–Meier method, and the significance of the difference in survival rates was determined using the log-rank test.

