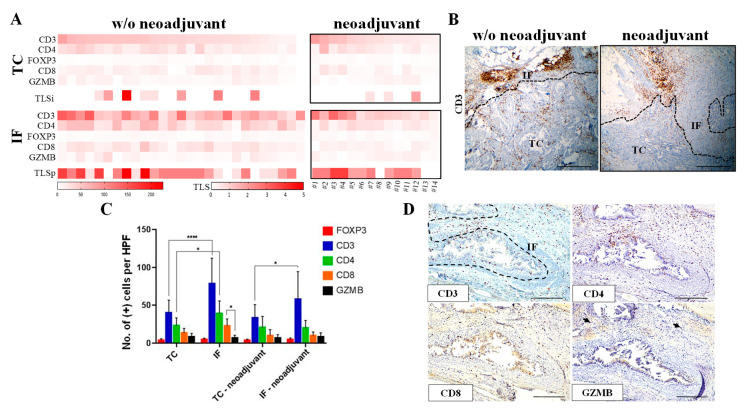
Figure 1.
Distinct immune profile in the tumor center (TC) and the invasive front (IF) in pancreatic ductal adenocarcinoma (PDAC) patients. (A) Heatmap analysis of the protein expression of immune-related markers in the TC and the IF of PDAC receiving or not receiving neoadjuvant chemotherapy. Cases that received neoadjuvant chemotherapy are numbered in the heat map analysis from left to right as 1–14 (see Table S2). TLSi: tertiary lymphoid structures (intratumoral); TLSp: tertiary lymphoid structures (peritumoral). (B) Representative CD3 immunohistochemical staining showing increased CD3 positive cells (brown color) in the invasive front (IF) versus the tumor center (TC) in a patient without (w/o) neoadjuvant treatment (left panel) and a patient who received neoadjuvant treatment (right panel). Dashed line depicts the IF. Scale bar: 500 μm. (C) Quantification of the positive cells for indicated markers, assessed by immunohistochemistry. Data are reported as number of positive cells per high power field (HPF, magnification 400×). IF: invasive front; TC: tumor center. * p-value < 0.05, **** p-value < 0.0001. Data are expressed as mean ± standard deviation (STDEV) (N = 27, patients without neoadjuvant therapy; N = 14, patients with neoadjuvant chemotherapy). (D) Representative micrographs from serial section analysis assessing the expression of the T cell specific markers CD3, CD4, CD8, and granzyme B (GZMB) in primary lesions. Dashed line depicts the IF. Arrows denote positive GZMB immunostaining.

