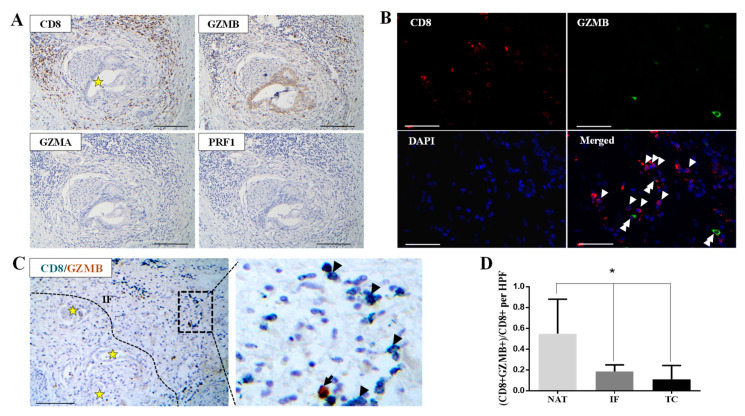
Figure 2.
Decreased cytotoxic potential in CD8+ cells in PDAC. (A) Representative micrographs from serial section analysis demonstrating decreased granzyme A (GZMA), perforin 1 (PRF1), and granzyme B (GZMB) immunostaining in the IF in PDAC. Asterisk denotes perineural invasion by cancer glands. Scale bar: 100 μm. (B) Representative micrographs showing the expression of CD8 (red) and granzyme B (green) in the tumor center (TC). Nuclei were counterstained with 4′,6-diamidino-2-phenylindole (DAPI) (blue). Arrowheads indicate CD8+ cells, and double arrowheads indicate CD8+/GZMB+ cells. Scale bar: 100 μm. (C) Representative micrographs showing GZMB (brown) and CD8 (emerald) expression assessed by double immunohistochemical staining in the invasive front (IF) from the PDAC case presented in (A). Arrowheads indicate CD8+ cells, and the arrow indicates a CD8+/GZMB+ cell. Dashed line delineates the IF. Asterisks depict cancer glands. Scale bar: 200 μm. (D) Quantification of the percentage of GZMB/CD8 double positive cells in the invasive front (IF), the tumor center (TC), and the normal parenchyma adjacent to the tumor (NAT). * p-value < 0.05. Data are expressed as mean ± STDEV (N = 6).

