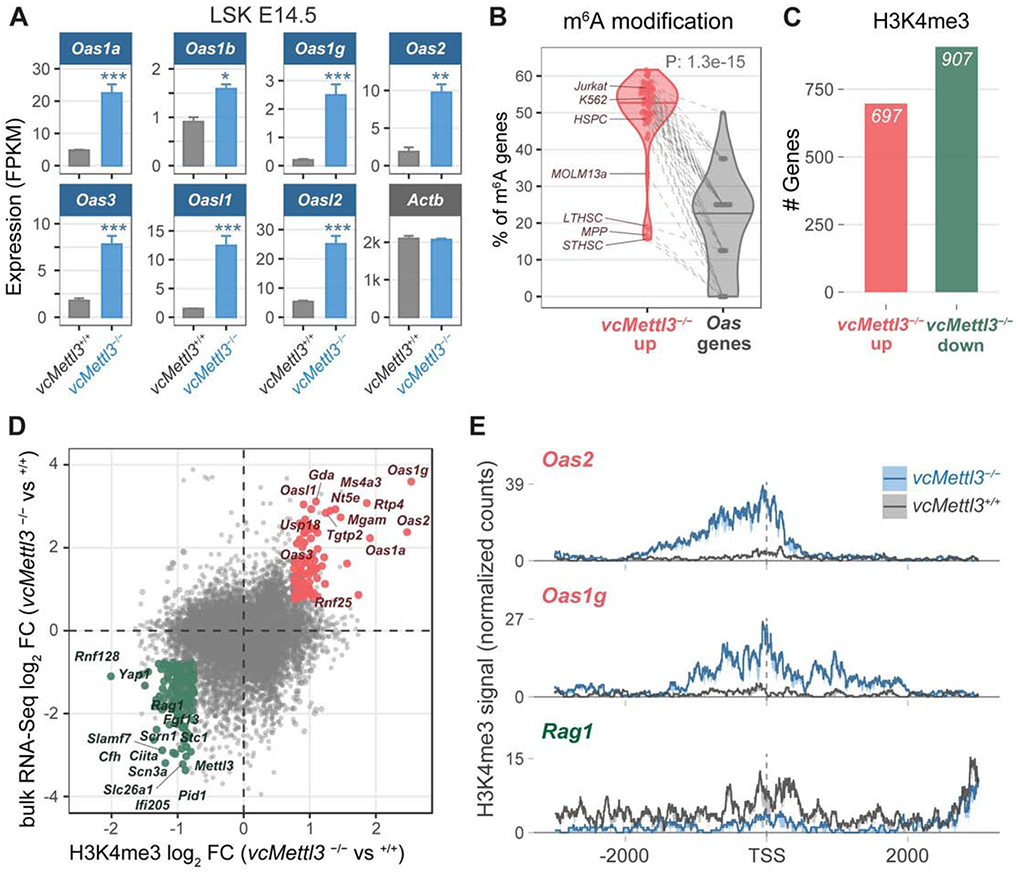
Figure 4. OAS family genes are highly upregulated via epigenetic regulation in response to Mettl3 loss in HSPCs.

(A) Oas family gene expression in vcMettl3+/+ and vcMettl3−/− E14.5 fetal liver LSK cells as measured by RNA-seq (n=3 biological replicates per group).
(B) Percentage of genes with annotated m6A peaks in Oas genes compared to the remaining genes upregulated in vcMettl3−/− LSK. The meta-analysis was performed with 52 different published m6A datasets.
(C) Number of genes with significantly increased (red) versus decreased (green) H3K4me3 occupancy around the transcription start site (TSS) in vcMettl3−/− versus vcMettl3+/+ LSK cells (n=2 biological replicates per group).
(D) Scatterplot comparing gene expression changes (y-axis) versus H3K4me3 occupancy changes (x-axis) between vcMettl3−/− and vcMettl3+/+ LSK cells. Genes with consistent and significant epigenetic and gene expression changes are highlighted (red=up, green=down).
(E) H3K4me3 occupancy profiles of Oas1g, Oas2 and Rag1 (3k bp around the TSS) in vcMettl3+/+ and vcMettl3−/− LSK cells. The average normalized signal and standard error from 2 replicates is displayed.
The P value in (B) was calculated using two-tailed Wilcoxon rank-sum test.
See also Table S1.
