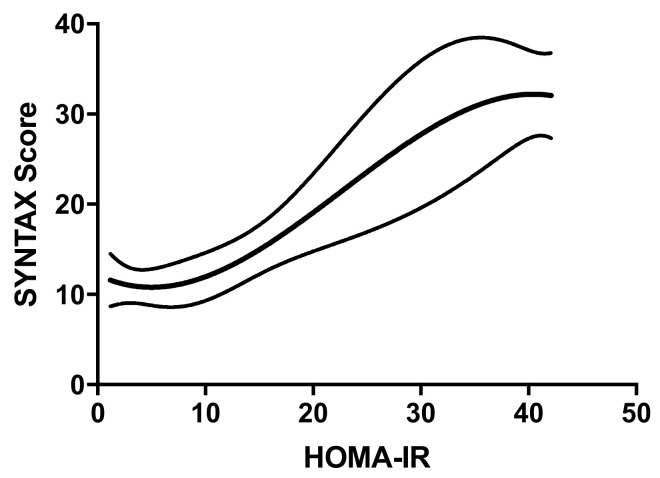
Figure 3.
Plot of the non-parametric regression with natural cubic splines, showing the correlation between HOMA-IR and SS. This plot shows the correlation between HOMA-IR and SS. The upper and lower lines represent the 95% confidence intervals (CI). The equation used is the following: SS = 12.19 − 0.5812 * HOMA-IR + 0.06551 * (HOMA-IR)2 −0.0009619 * (HOMA-IR)3.

