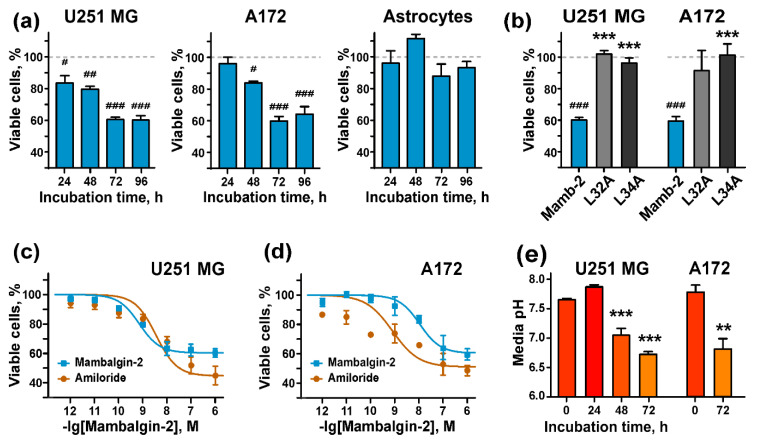
Figure 4.
Mambalgin-2 influence on growth of U251 MG and A172 glioma cells and normal astrocytes: (a) 1 µM mambalgin-2 effect on U251 MG, A172 cells and astrocytes proliferation during different incubation times. Data are presented as % of control (untreated cells, dashed line) ± SEM (n = 4). # (p < 0.05), ## (p < 0.01), and ### (p < 0.001) indicate significant difference from the control according to One-way ANOVA followed by Dunnett’s test; (b) Influence of 1 μM mambalgin-2 and its Leu32Ala and Leu34Ala mutants on proliferation of U251 MG and A172 cells during 72-h incubation. Data are presented as % of control (untreated cells, dashed line) ± SEM (n = 4). ### (p < 0.001) indicates significant difference from the control according to One-way ANOVA followed Dunnett’s hoc test. *** (p < 0.001) indicates significant difference in activity of mutants and mambalgin-2 according to One-way ANOVA followed by Dunnett’s test; (c,d) effect of different mambalgin-2 and amiloride concentrations on U251 MG (c) and A172 (d) cell growth during 72-h incubation. The parameters describing concentration-effect curves (EC50, A0) are given in the Table 1. Data are presented as % of control (untreated cells) ± SEM (n = 3–11); (e) analysis of the pH value of culture medium during prolonged cultivation of U251 MG and A172 cells (n = 4). ** (p < 0.01) and *** (p < 0.001) indicate significant difference from the pH value of the culture media in an initial time point according two-tailed t-test.

