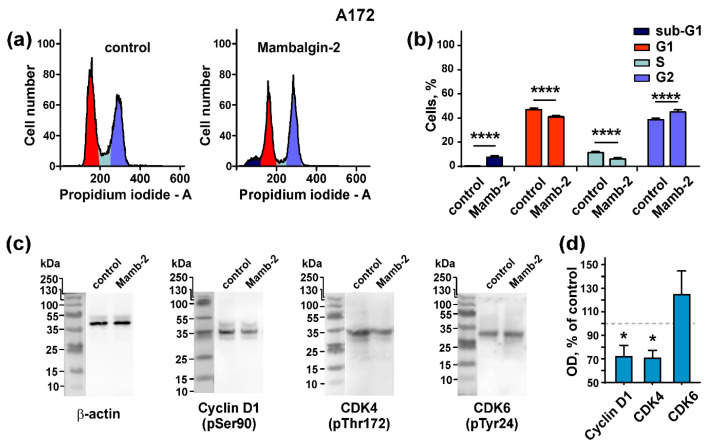
Figure 6.
Mambalgin-2 influence on the cell cycle and activity of cell cycle regulators in A172 cells: (a) Representative nuclei population distributions of cells after 72-h incubation in absence (control) or presence of 1 µM mambalgin-2; (b) % of cells in each cell cycle phase determined by ModFitLT Software. Data are presented as % of cells in each cell cycle phase ± SEM, n = 4; **** (p < 0.0001) indicates the significant difference from the control by two-tailed t-test; (c) Representative Western blots, showing the mambalgin-2 influence on phosphorylation of Cyclin D1 (pSer90), CDK4 (pThr172), and CDK6 (pTyr24); (d) The optical density (OD) of blot bands for comparison of the Cyclin D1 (pSer90), CDK4 (pThr172), CDK6 (pTyr24) expression upon 72-h incubation of the cells in absence (control) or presence of 1 µM mambalgin-2. Data are presented as normalized to the β-actin band intensity, where untreated cells are taken as the control (100%, dashed line) ± SEM, n = 6; * (p < 0.05) indicates the significant difference between the control and mambalgin-2 treated cells by two-tailed t-test.

