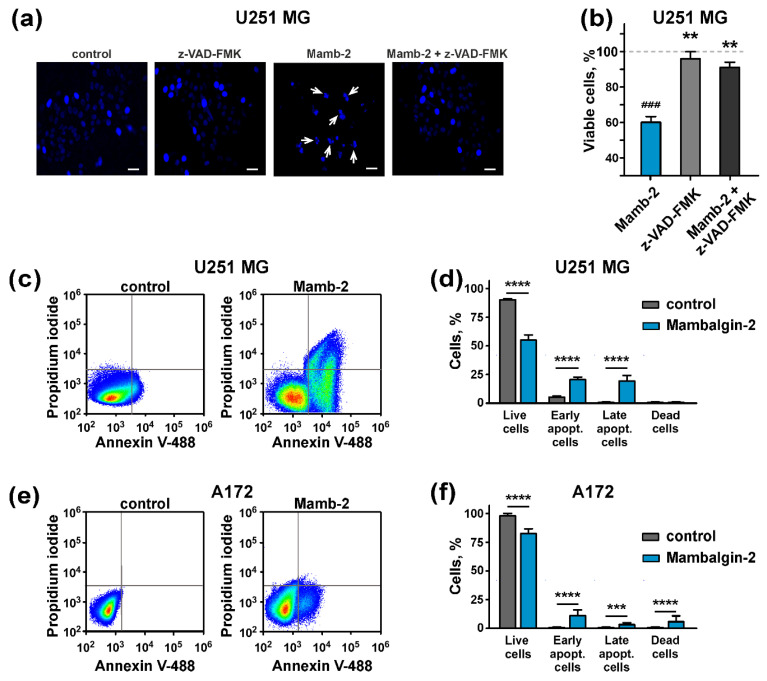
Figure 7.
Apoptosis induction by mambalgin-2 in U251 MG and A172 cells: (a) Microscopic examination of nuclei morphology of U251 MG cells after their incubation with 1 µM mambalgin-2 in absence or presence of pan-caspase inhibitor z-VAD-FMK, scale bar = 10 µm; (b) Influence of mambalgin-2 and z-VAD-FMK on U251 MG cell proliferation. Data are presented as % of control (untreated cells, dashed line) ± SEM (n = 4). ### (p < 0.001) indicates significant difference between treated and untreated cells according to One-way ANOVA followed by Dunnett’s test. ** (p < 0.01) indicates significant difference from the mambalgin-2 treated cells according to One-way ANOVA followed by Dunnett’s test; (c,e) representative pictures of phosphatidylserine externalization analysis upon the mambalgin-2 treatment of U251 MG and A172 cells by flow cytometry with Annexin V-488 and Propidium iodide; (d,f) percentage of U251 MG and A172 cells with externalized phosphatidylserine and bound propidium iodide upon 72-h incubation in absence (control) or presence of 1 µM mambalgin-2. The data are presented as % of live, early apoptotic, late apoptotic and dead cells ± SEM (n = 4). *** (p < 0.001) and **** (p < 0.0001) indicate the significant difference of the groups from each other by a two-tailed t-test.

