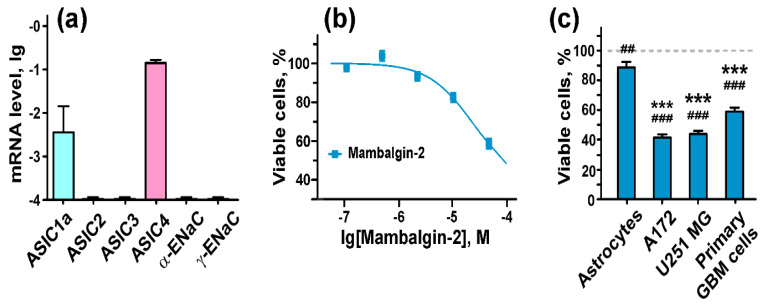
Figure 8.
Mambalgin-2 effect on cells of primary culture obtained from a patient with glioblastoma (GBM). (a) Analysis of ASICs and ENaCs gene expression in primary GBM cells by qPCR. Gene expression was normalized to the β-ACTIN, GPDH and RPL13a housekeeping genes and presented as lg of relative mRNA level ± SEM (n = 3–5); (b) Influence of different mambalgin-2 concentrations on viability of primary GBM cells. Cells were incubated for five days with mambalgin-2 and their viability was accessed by Alamar Blue assay. Data are presented as % of control (untreated cells) ± SEM (n = 3); (c) Comparison of the 50 µM mambalgin-2 inhibitory effect on viability of normal astrocytes, U251 MG, A172, and primary GBM cells by Alamar Blue assay. Data are presented as % of control (untreated cells, dashed line) ± SEM (n = 3). ## (p < 0.01) and ### (p < 0.001) indicate significant difference between treated and untreated cells according to One-way ANOVA followed by Dunnett’s test. *** (p < 0.001) indicates significant difference of mambalgin-2 action on cells from the effect on astrocytes according to One-way ANOVA followed by Dunnett’s test.

