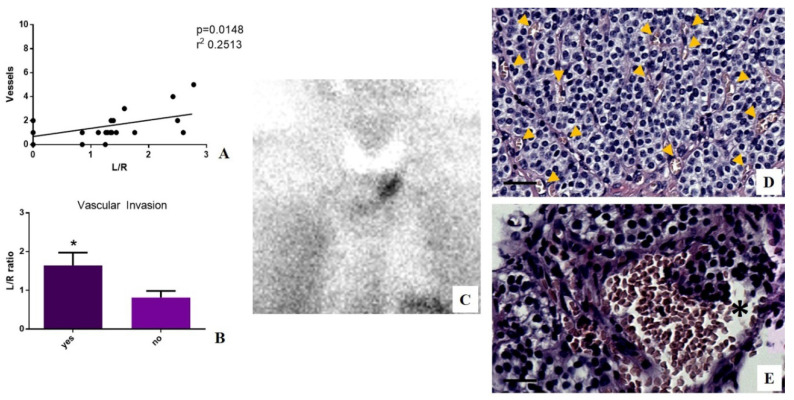
Figure 3.
Evaluation of sestamibi uptake, angiogenesis, and vascular invasion in patients affected by hyperparathyroidism. (A) Graph shows linear regression analysis between the number of vessels and L/N ratio. (B) Graph displays a significant increase in sestamibi uptake in parathyroid lesions showing vascular invasion (yes) as compared to lesions without vascular invasion (no) (* p = 0.0377). (C) Image shows [99mTc]Sestamibi uptake in a 61-year-old man with primary hyperparathyroidism. A parathyroid carcinoma (0.7 cm) was identified after the surgery by histological analysis. (D) Image displays numerous vessels (yellow arrows) in a tumor area. (E) Image shows a large vessel with several cancer cells (asterisk). Scale bar represents 100 µm in all images.

