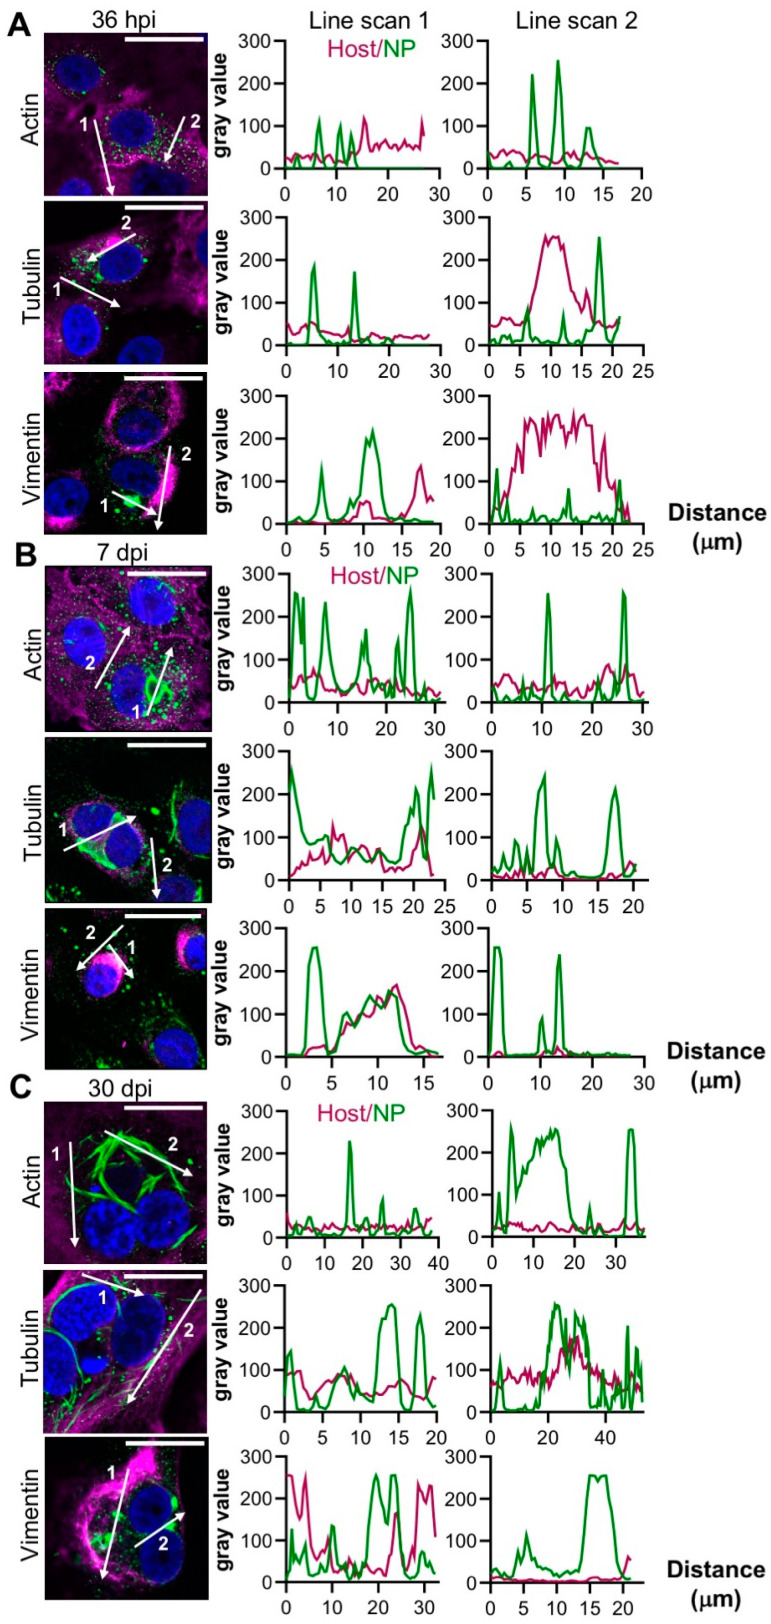
Figure 3.
Co-localisation between the TULV NP and cytoskeletal filaments at the early, peak and persistent stages of TULV infection in Vero E6 cells. The spatial distribution of the cytoskeletal markers actin, tubulin and vimentin (magenta) was observed alongside TULV NP (green) in Vero E6 cells infected with TULV at a MOI of 0.1 by confocal microscopy at 40× magnification at (A) 36 h post infection (hpi), (B) 7 days post infection (dpi), and (C) 30 dpi. The scale bar represents 30 μm. Fluorescent line scans were taken using Fiji software with the designated number labels corresponding to adjacent line scan plots. Nuclei were stained with DAPI (blue), the TULV NP was detected using NP antisera and the cytoskeleton was detected using primary antibodies against β-actin, β-tubulin and vimentin. Images shown in panels A, B and C show the representative analysis of 87, 109 and 58 cells, respectively.

