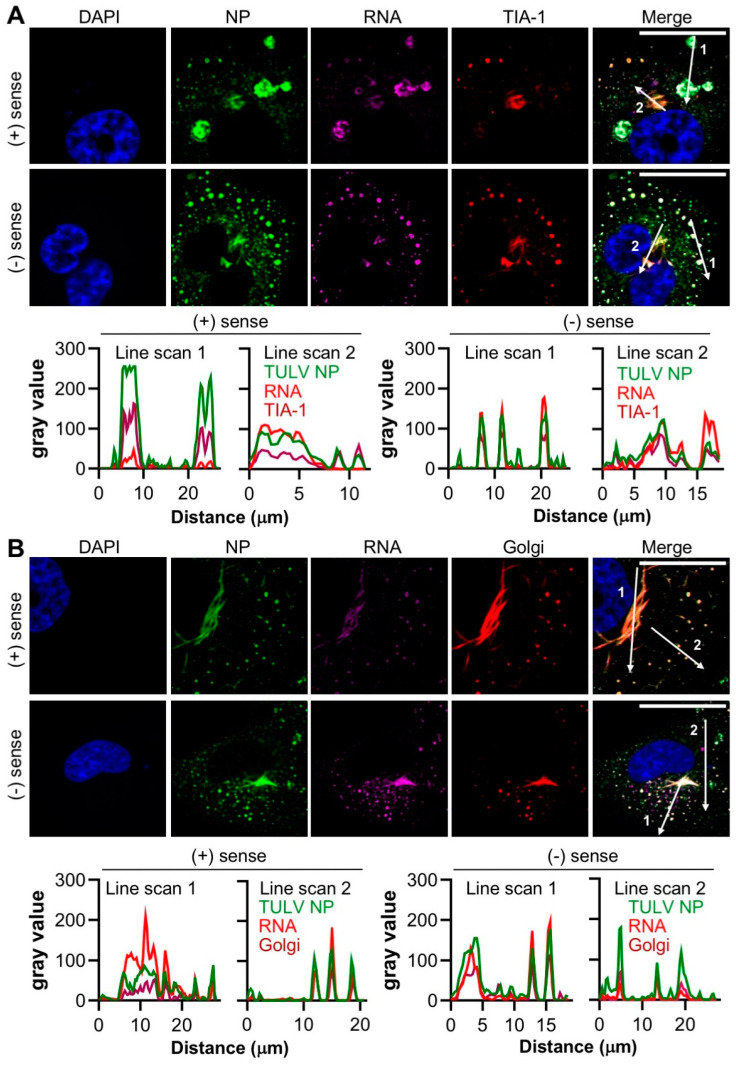
Figure 7.
Co-localisation between the TULV NP, the TULV S segment positive and the negative sense RNAs and host cell components TIA-1 and the Golgi marker in Vero E6 cells at 30 days post infection. The spatial distribution of the TULV NP (green), the S segment RNA (magenta) and the host cell markers (A) TIA-1, or (B) Golgi (both red) were observed during the persistent infections using confocal microscopy at 40× magnification. Fluorescent line scans were taken using Fiji software with designated number labels corresponding to the adjacent line scan plots. The nuclei were stained with DAPI (blue), TULV NP was detected using NP antisera, with TIA-1 and Golgi detected using specific antisera. Scale bar represents 30 μm. TULV NP was detected using NP antisera, and S segment RNAs were detected using separate sets of positive sense or negative-sense RNA FISH probes. Images shown in panels A and B show a representative analysis of 8 and 20 cells, respectively.

