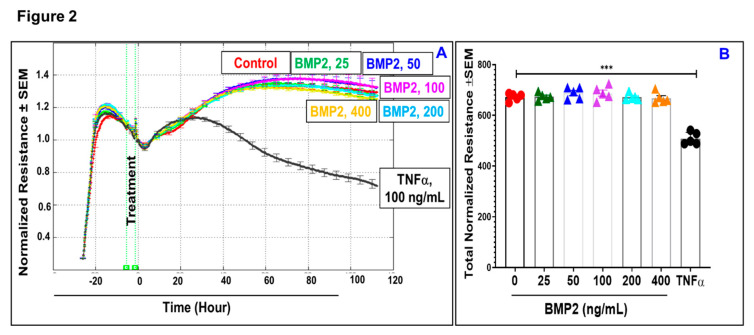
Figure 2.
Normalized resistances of BMP2-treated ARPE-19 cells measured at a frequency of 4000 Hz by electrical cell-substrate impedance sensing (ECIS) (A), and the statistical analysis (B). Our experiments were carried out after ARPE-19 cells formed confluent mature monolayers indicated by a plateau of electronic resistance, where the resistance reached 1000 ohms. However, to monitor changes in the resistance in real time, the data are presented as normalized TER resistance calculated by dividing the resistance of each well measured in ohms at each time point by the baseline resistance (ohms) acquired before the addition of the BMP2 and plotted as a function of time. There was no significant drop in the resistances of ARPE-19 cells with direct BMP2-treatment in the range of (0–400 ng/mL) over the experimental period as compared to positive control of TNF-αtreated ARPE-19 cells. Red circles: control; green triangles: BMP2 (25 ng/mL); blue triangles: BMP2 (50 ng/mL); purple triangles: BMP2 (100 ng/mL); aqua triangles: BMP2 (200 ng/mL); orange triangles: BMP2 (400 ng/mL); black circles: TNFα (100ng/mL). Results are presented as mean ± SEM, n = 4–6; *** = P < 0.001.

