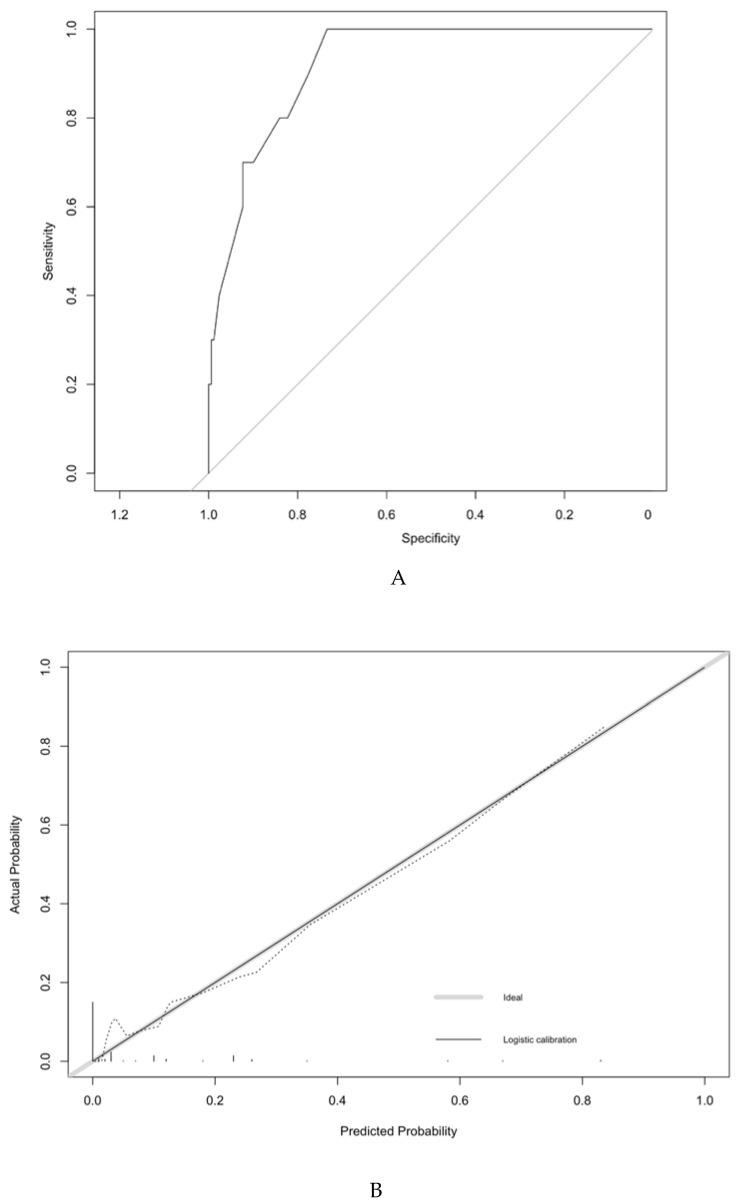
Figure 3.
Discrimination and validation of the model predicting the likelihood of a parametrial involvement in patients with early stage cervical cancer. ROC curve of the model. The predictive model had an AUC of 0.92 (IC95% = 0.86–0.98). For the calibration of the model, the horizontal axis represents the predicted probability of a parametrial involvement, and the vertical axis represents the actual probability of parametrial invasion. Perfect prediction would correspond to the 45-degree broken line. The dotted and solid lines indicate the observed (apparent) nomogram performance before and after bootstrapping.

