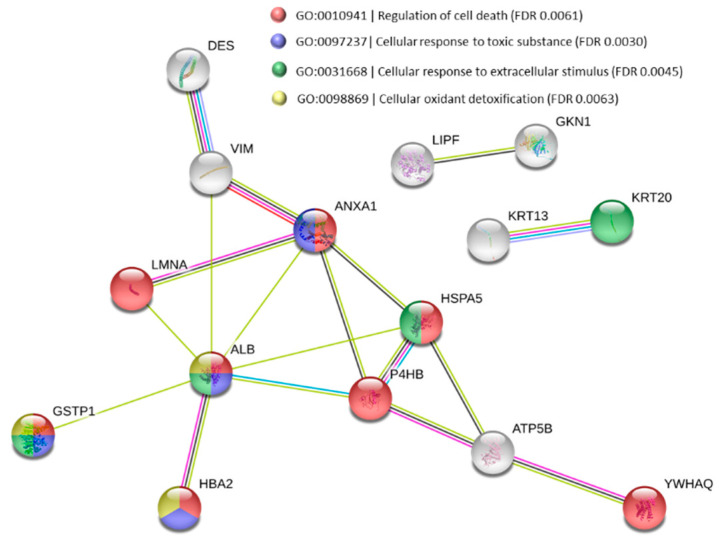
Figure 4.
Protein–protein interaction map of 15 differential proteins between test groups. Three biological processes were characteristic of disease progression. Nodes are representative of protein species and lines represent protein–protein association. Nodes of the same color and/or joined by lines represents to a shared function. The STRING tool (http://www.string-db.org) was used to construct the interaction networks. Desmin (DES); vimentin (VIM); annexin A1 (ANXA1); prelamin-A/C (LMNA); serum albumin (ALB); glutathione S-transferase p (GSTP1); hemoglobin subunit beta (HBA2); Endoplasmic reticulum chaperone BiP (HSPA5); protein disulfide-isomerase (P4HB); ATP synthase subunit beta (ATP5B); 14-3-3 protein theta (YWHAQ); gastric triacylglycerol lipase (LIPF); gastrokine-1 (GKN1); keratin 13 (KRT13); keratin 20 (KRT20).

