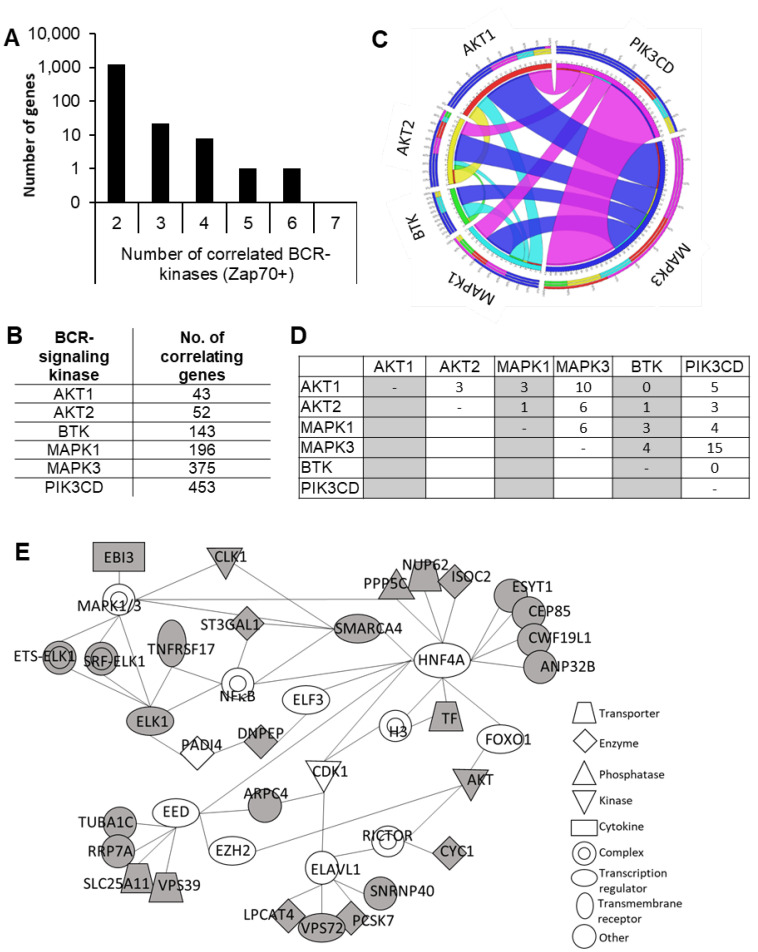
Figure 1.
Partial integration and diversity in gene expressional programs that drive the expressions of BCR-signaling kinases. (A) Total number of genes whose expressions correlated with that of ZAP70 and at least one other BCR-signaling kinase in at least five datasets. (B) The number of correlating genes identified for each BCR-signaling kinase. (C) Circos plot showing the distribution of common targets of BCR-signaling kinase pairs. (D) Matrix representation of the number of genes that are common correlating genes of BCR-signaling kinase pairs. (E) Interaction network of the 32 genes identified. Ingenuity pathway analysis was carried out to identify gene networks the 32 BCR-signaling kinase co-expressed genes reported on. Grey-shaded genes are the identified BCR-kinase correlating genes.

