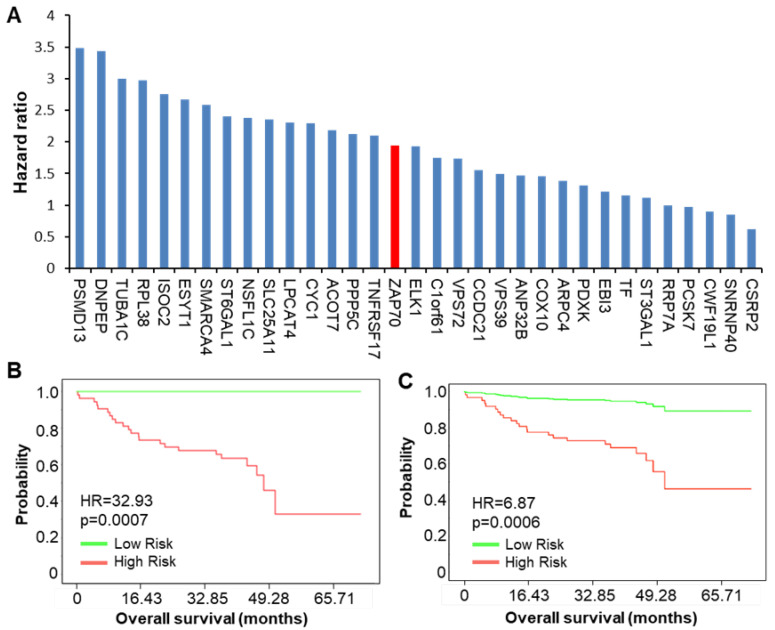
Figure 3.
Prognostic potential of genes correlating with BCR-signaling kinases regarding the overall survival. (A) Bar graph showing the hazard ratios for the overall survival associated with each of the 32 genes in the panel. The HR of ZAP70 (red bar) is added as a reference. (B,C) Kaplan Meier plots showing the overall survival probability curves for the 32 genes together (CI: 4.4 to 246.3) (B) and the combination of the eight genes with the highest HR value (from graph in part A, (CI: 2.28 to 20.67, p = 0.0006)). The y-axis represents the estimate probabilities, and the x-axis represents the time to treatment (months).

