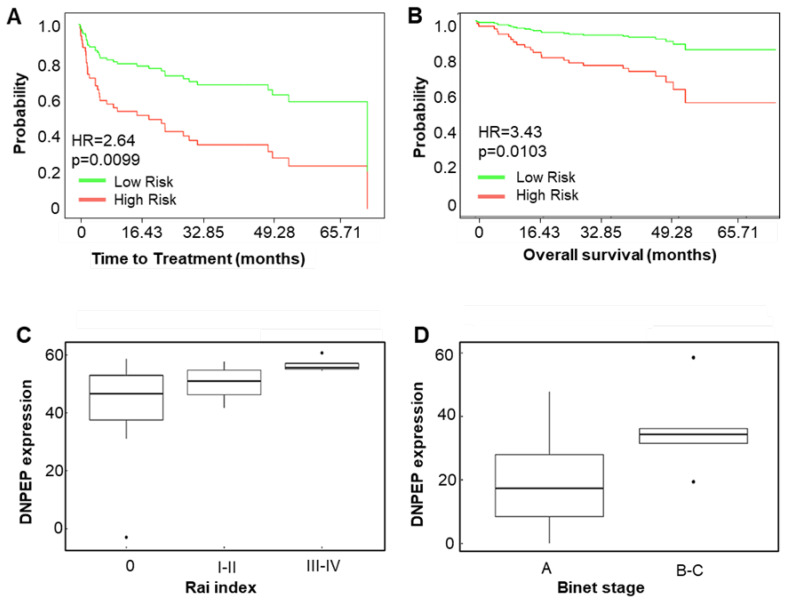
Figure 4.
Prognostic potential of DNPEP. Kaplan-Meier plots for time-to-treatment (A) and overall survival (B) for DNPEP expression (CI: 1.26 to 5.54 and CI: 1.34 to 8.79 for A and B, respectively). (C,D) Correlation between DNPEP expression and disease stage. Patient samples were divided into low risk and high risk based on the median DNPEP mRNA expression, and the time to treatment and overall survival probabilities were graphed. The DNPEP mRNA expression was determined by quantitative real-time (RT)-PCR from 34 chronic lymphocytic leukemia (CLL) patient RNA samples. The box plots show the DNPEP expressions by Rai (C) and Binet (D) staging. (C) The difference between the DNPEP transcript levels of the Rai medium-risk (I–II) and high-risk (III-IV) groups and between the asymptomatic stage (Rai 0) and high risk (III–IV), as well as (D) between the early stage (Binet A) and late metastatic stages (Binet B and C), were significant (p = 0.0019, p = 0.0014, and p = 0.024, respectively).

