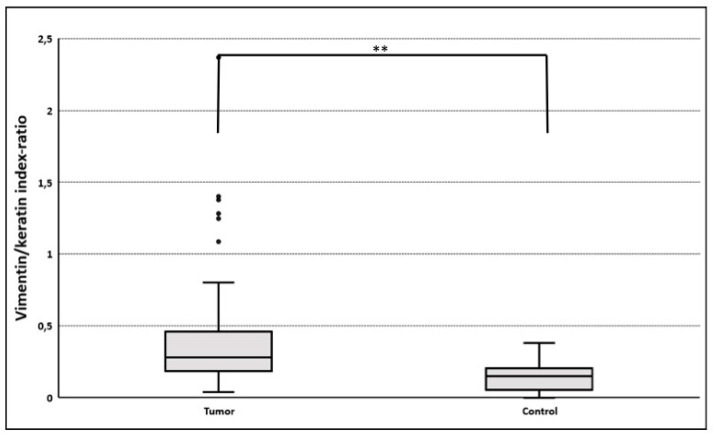
Figure 2.
Vimentin/cytokeratin index ratio in tumor and control samples. Co-expression data based on single cell analyses were not available for controls. Instead, the ratio vimentin fluorescence index/cytokeratin fluorescence index in tumor cell areas (n = 74) and epithelial layer of controls (n = 9) was used to quantify epithelial to mesenchymal transition (EMT) [20,25,26]. A higher vimentin/cytokeratin index ratio suggests a more mesenchymal phenotype. Because of the low number of controls (n = 9) parametric, statistical evaluation was not possible. The median vimentin/cytokeratin index ratio was 0.28 (LQ 0.19; UQ 0.46) in tumor cell areas and 0.15 (LQ0.05; UQ 0.21; ** p < 0.005).

