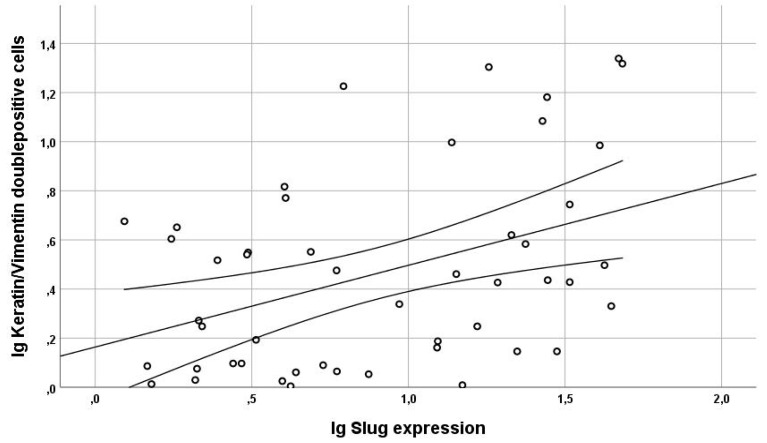
Figure 4.
Correlation Slug expression and cytokeratin/vimentin co-expression. Regression analysis of the logarithmic percentage of Slug positive cells with the logarithmic percentage of cytokeratin/vimentin double-positive partial EMT cells. The two curved lines indicate the 95%-confidence interval, whereas the straight line displays the regression line. The percentage of Slug-positive cells in the tumor cell areas correlated positively with the percentage of cytokeratin/vimentin double-positive partial EMT cells (r = 0.41; R2 = 0.17; p = 0.005).

