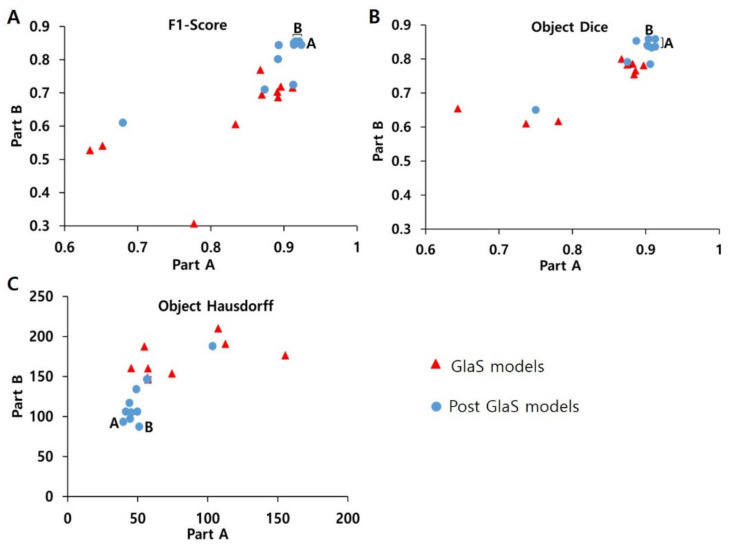
Figure 3.
Comparison between (A) F1-score, (B) object Dice, (C) object Hausdorff of GlaS models, and Post-GlaS models. Part A means data used as off-site and Part B data used as on-site and A and B indicate the best model for Parts A and B, respectively. The models by Yan, Yang, and Zhang et al. show the best F1-scores, the models by Yang, Ding, and Graham show the best object Dice, the models by Ding and Manivannan et al. show the best object Hausdorff.

