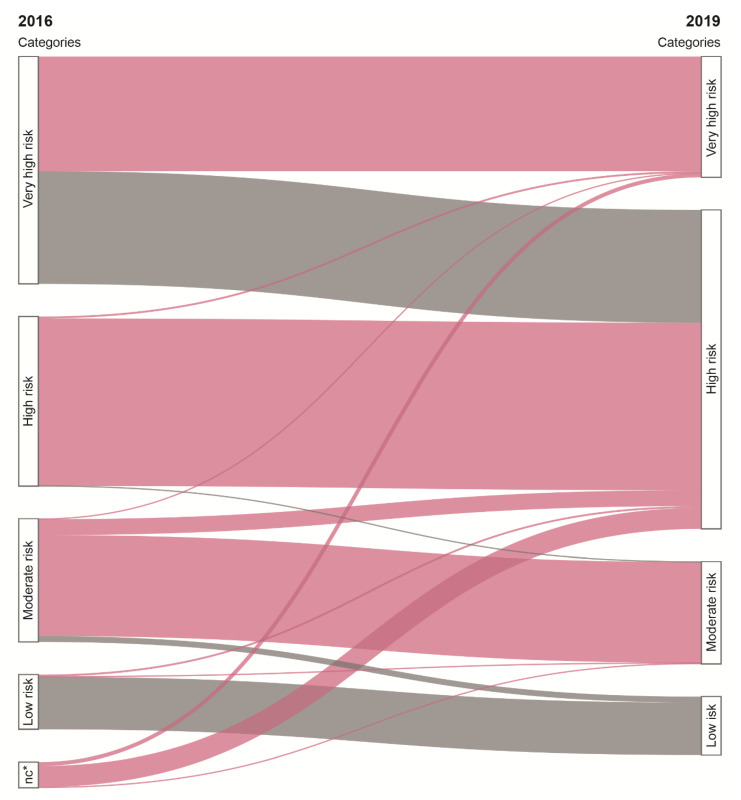
Figure 2.
Impact of the 2019 ESC/EAS guideline on CV risk classification and LDL-C target values. Flows represent patients’ classification according to the 2016 and 2019 guidelines; the size of each flow is in proportion to the number of patients. Colors indicate changes in LDL-C target values: red: decrease of LDL-C target value, grey: no change of LDL-C target value. * no classification.

