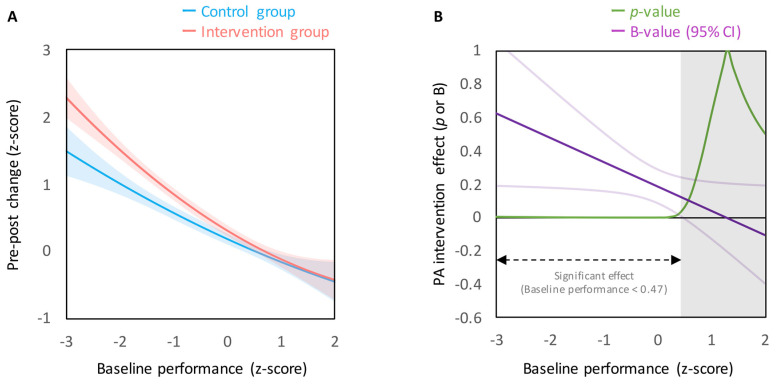
Figure 1.
(A) Relationship between baseline performance and pre–post changes in cognitive performance, illustrating the group × baseline performance interaction. Regression lines are shown with 95% confidence bands (shaded areas). (B) Relationship between baseline performance and the PA (physical activity) intervention effects. The PA intervention effects were statistically significant if baseline performance was lower than mean +0.47 SD.

