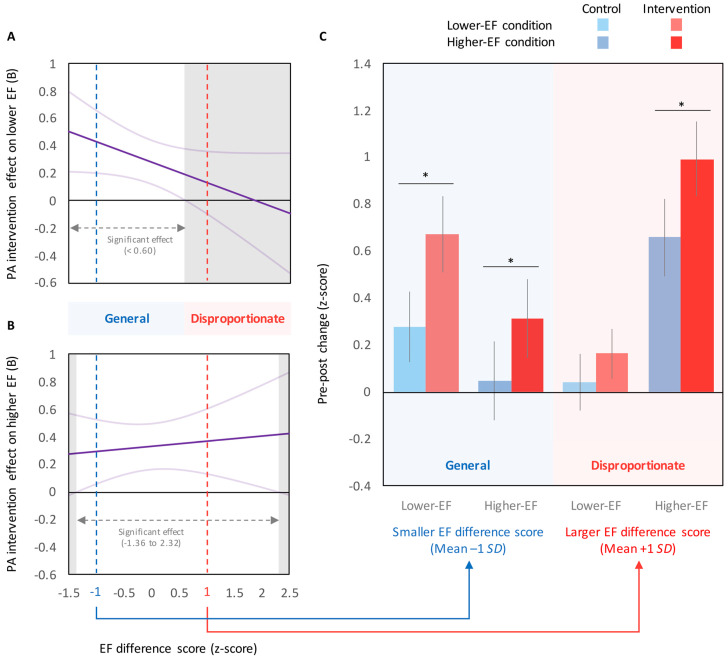
Figure 3.
(A,B) The Johnson–Neyman regions of significance for the relationship between EF difference score and PA intervention effects (B-value ± 95% CI; A: lower EF condition; B: higher EF condition). (C) Typical examples of the general (mean −1 SD) and disproportionate (mean +1 SD) effects of PA intervention on EF performance. Values are presented as mean ± 95% confidence interval. * p < 0.05.

