Figure 1.
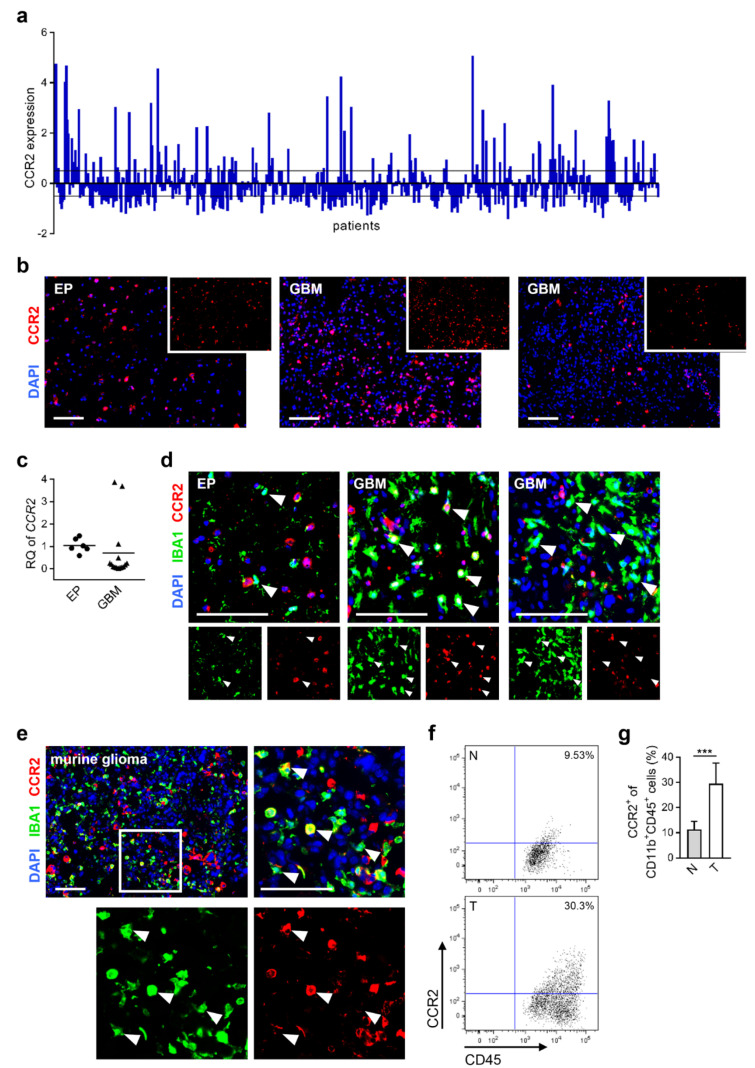
CCR2 is expressed within human and murine glioma tissues. (a) Expression data of CCR2 from glioblastoma patients were used from TCGA Affymetrix U133A data (528 GBM patient samples). The relative gene expression of each patient is depicted (each column represents one patient). Black lines define the z-score threshold (0.5). (b) Human epilepsy (EP) and GBM brain tissue sections stained for CCR2. Scale bars 100 µm (n = 3–6). (c) Myeloid cells (CD11b+) were isolated from freshly homogenized human brain tissues, and RNA was extracted. Realtime-PCR for CCR2 is presented (n = 6–15). (d) Representative images of frozen human brain sections stained for IBA1 and CCR2 are depicted (arrowheads define IBA1+ cells). Scale bars 100 µm (n = 3–6). (e) Murine brain tumor sections were analyzed for IBA1 and CCR2 on day 21 of glioma growth. A representative image of the intratumoral area is shown (square illustrates magnification of tumor tissue area; arrowheads define IBA1+ cells expressing CCR2). Scale bars 100 µm (n = 3). (f) Murine brain cells were stained with CD11b, CD45, and CCR2 antibodies and analyzed via flow cytometry. Dot plots represent the expression of CCR2 of CD11b+CD45+ myeloid cells within naïve (N) and tumor-bearing (T) brains. (g) Graph depicts percentage of CCR2+ cells within the CD11b+CD45+ cell fraction (n = 10–12). *** p < 0.001 (unpaired Student’s t-test).

