Figure 3.
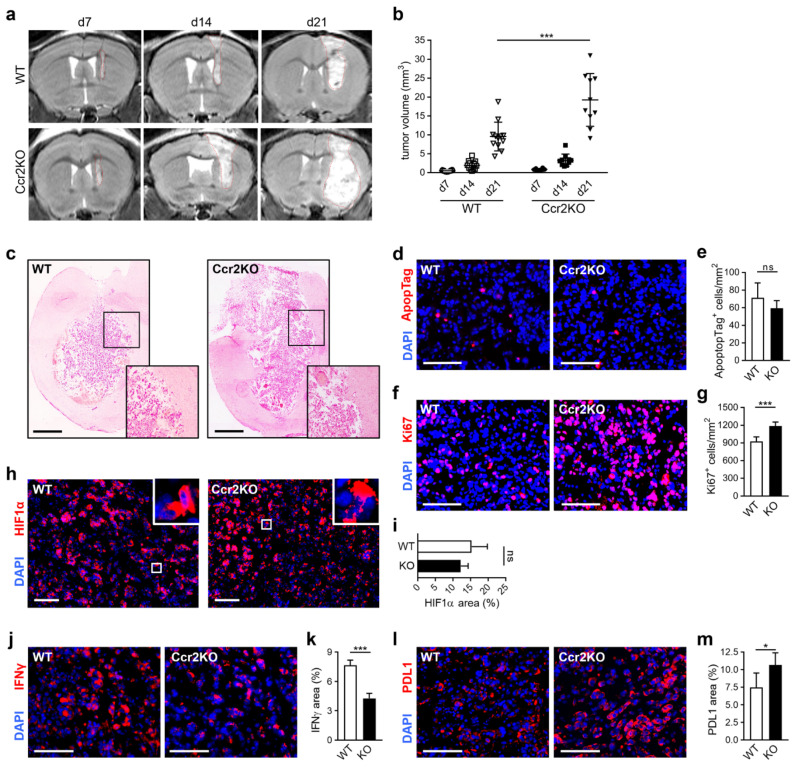
Glioma growth is enhanced in Ccr2-deficient mice. (a) Tumor sizes of gliomas were measured with MRI on day 7, 14, and 21 after inoculation with GL261 cells. Representative MRI images are shown for the WT (upper row) and Ccr2KO (lower row) mice. Red dashed lines define tumor borders. (b) Graph displays calculated tumor volumes (n = 10–12). *** p < 0.001 (one-way ANOVA and Bonferroni’s multiple comparison test). (c) Representative images of hematoxylin-eosin-stained tissue sections of tumor-bearing WT and Ccr2KO brains are shown for day 21 (n = 4–5). Squares indicate magnified regions of the tumor border. Scale bars 1000 µm. (d,f) Apoptosis (d) and proliferation (f) of the intratumoral area (d21) were analyzed by immunofluorescence staining of ApopTag (d) and Ki67 (f). Scale bars 100 µm. (e,g) Graphs depict the amount of apoptotic (e) and proliferative (g) cells within glioma tissues (n = 6). (h) HIF1α was stained to detect hypoxia in tumor tissues (d21). Squares indicate magnified regions. Scale bars 100 µm. (i) Calculation for area of HIF1α expression (n = 5). (j–m) Tissues were stained for IFNγ (j) and PDL1 (l). Scale bars 100 µm. Positive areas of IFNγ (k) and PDL1 were calculated (m) (n = 4–5). *** p < 0.001; * p < 0.05; ns, not significant (unpaired Student’s t-test).

