Figure 4.
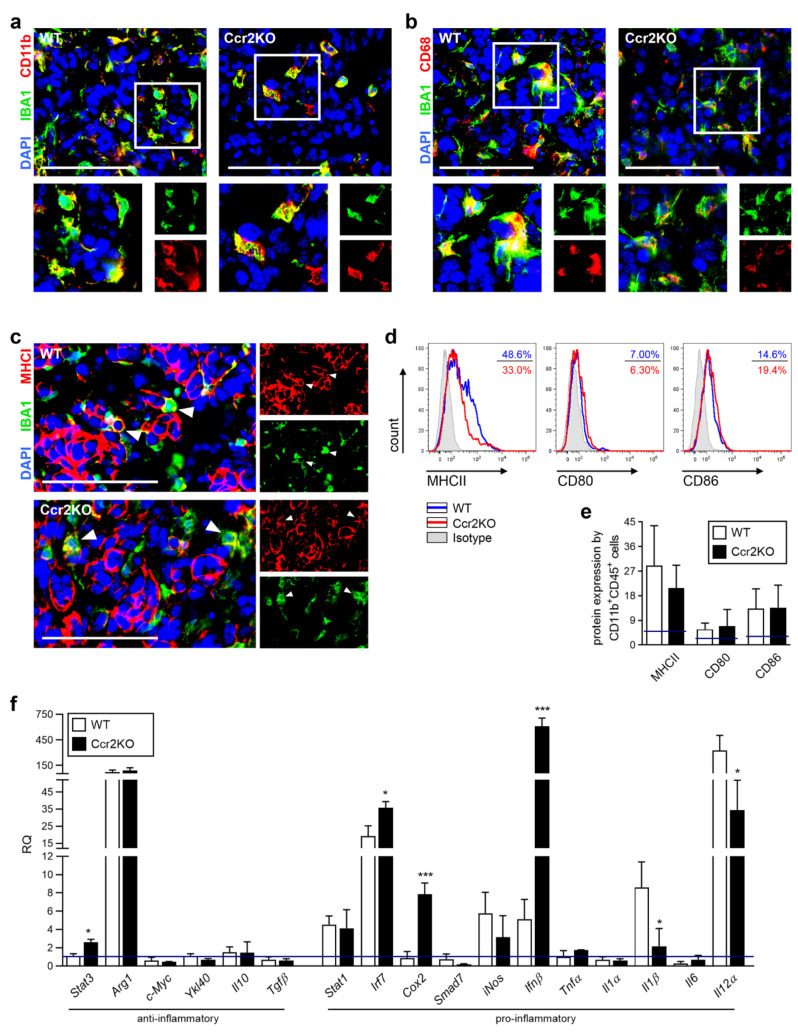
Tumor-associated macrophages (TAMs) of WT and Ccr2KO mice carry similar surface markers but show differences in expression of transcription factors as well as cytokines at day 21 of tumor growth. (a–c) Representative images of brain tumor sections of WT and Ccr2KO mice stained for IBA1 and CD11b (a) or CD68 (b) or MHCI (c) are depicted (n = 4–5). Squares indicate magnified regions (a,b). Arrowheads define IBA1+ cells expressing MHCI (c). Scale bars 100 µm. (d) Brain tumor suspensions were analyzed by flow cytometry after staining with CD11b, CD45, and MHCII, CD80, or CD86 antibodies. Histograms represent molecule expression of CD11b+CD45+ myeloid cells within WT and Ccr2KO mice including isotype controls. (e) The graph depicts the percentage of molecule expression (n = 6–14). Blue lines define basic molecule expression in naïve mice. (f) RT-PCRs for indicated genes of CD11b+ cells from tumor-bearing brain tissues of WT as well as Ccr2KO mice are presented (n = 3–4). Blue line defines basic molecule expression in naïve WT mice. *** p < 0.001; * p < 0.05 (unpaired Student’s t-test).

