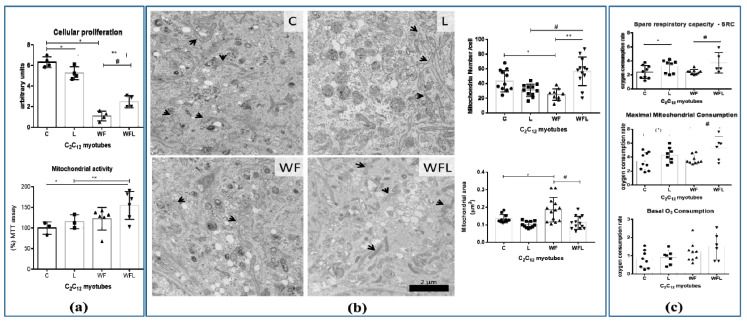
Figure 3.
C2C12 myotubes parameters under Walker Factor effects and modulation by leucine treatment. (a) In vitro MTT assay for assessing cell mitochondrial activity in C2C12 myotubes subjected to Walker Factor and leucine supplementation. (b) Representative ultrastructure images of mitochondria from C2C12 myotubes. Groups without tumour presented a greater number of mitochondria, when compared to the other tumour-bearing groups (W and WL). The leucine supplemented tumour-bearing group (WL) had more mitochondria than the tumour-bearing group fed a control diet (W). Magnification 10000×. Scale bar: 2µm, arrows indicate mitochondria. Bar graphics show the mitochondrial number and area for each group. (c) Basal O2 mitochondrial consumption; maximal mitochondrial respiration and spare respiratory capacity of the C2C12 myotubes measured in Oroboros Oxygraph-2K and DatLab software package (OROBOROS, Innsbruck, Austria). Experimental design applied on myotubes cells were sequentially treated with Oligomycin A (1 µM), FCCP (0.5 µM), and Antimycin A (1 µM) as indicated by the arrows. For more details see Material and Methods section. Leucine-treated C2C12 myotubes were incubated with leucine (50 μM, Sigma) for 24 h. Tumour-treated C2C12 myotubes were incubated for 24 h with Walker Factor at final concentrations of 25 μg/mL. Leucine/Walker Factor-treated C2C12 myotubes were exposed to 50 μM leucine and supplemented with tumour Factor at final concentrations of 25 μg/mL. For more details see Material and Methods section. Legend: control (C); leucine supplementation medium (L); Walker Factor treatment (WF) and Walker Factor treatment and leucine supplementation medium (WFL). * p < 0.05 difference against C group; ** p < 0.05 difference against L group: # p < 0.05 difference against WF group.

