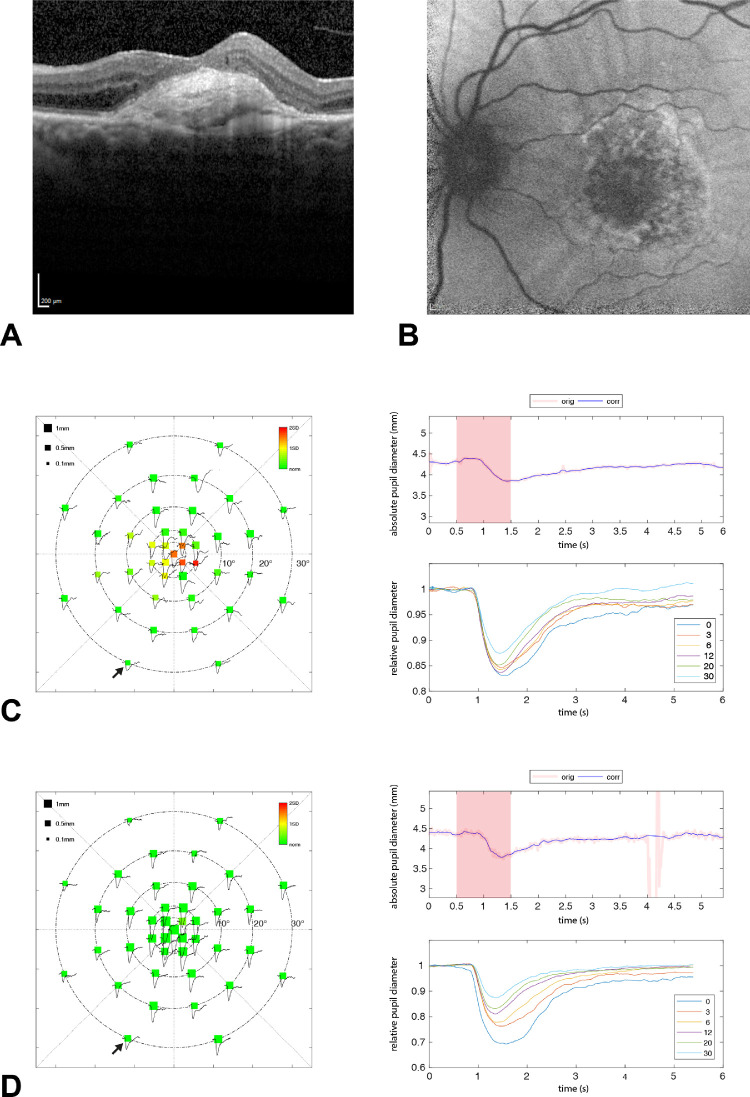
Figure 1.
Results of the left eye of AMD patient number 5. Horizontal OCT scan (A) and autofluorescence (B) of the macula with corresponding pupillographic results (C). The pupillographic results of one control subject are depicted as a comparison (D). The left column shows the averaged absolute values of the maximal constriction amplitudes per stimulus location within the 30° visual field. The size of the squares represents the amount of pupil constriction (in mm) after the respective local light stimulation. Color scale indicates a deviation from the mean of the age-matched control group from green to red. The upper right column shows the raw data of one exemplary pupillographic trace (location marked by a small black arrow). The reddish square area represents the time period of stimulus presentation. The averaged relative pupillary traces corrected for baselines and sorted by their eccentricity from the center with 0° to 30° are presented at the lower right column. A strong consistency between the central pupillographic functional defects and the central structural defects of the AMD patient is demonstrated.

