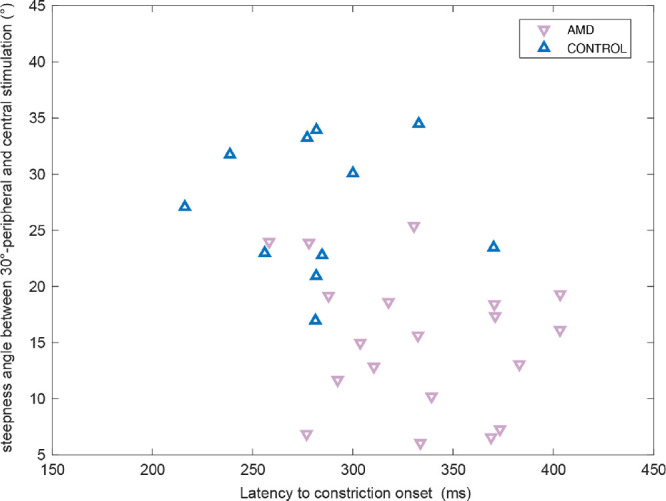
Figure 4.

Scatter plot of the steepness angle of pupillary constriction amplitudes between 30°-peripheral and central stimulation, and the latency to constriction onset in the fovea for each individual AMD subject (red down-pointing triangle) and age-matched control subjects (blue up-pointing triangle).
