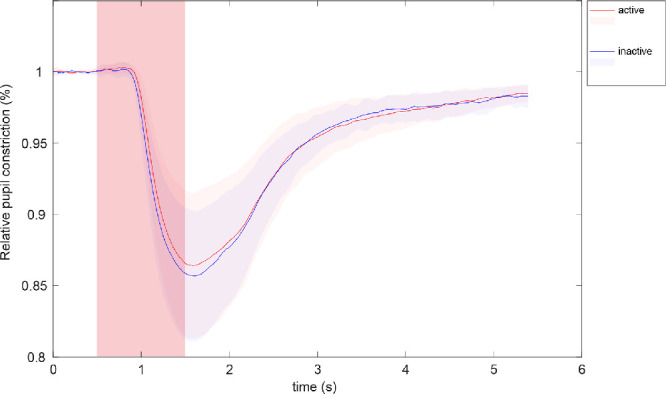
Figure 5.

Comparison of the mean relative pupil constriction amplitude (%) averaged over all stimulus locations within the damaged retina for each AMD patient who changed between status active (red) and status inactive (blue)—according to OCT—between the two measurements (n = 9). The reddish square area represents the time period of stimulus presentation.
