Figure 3.
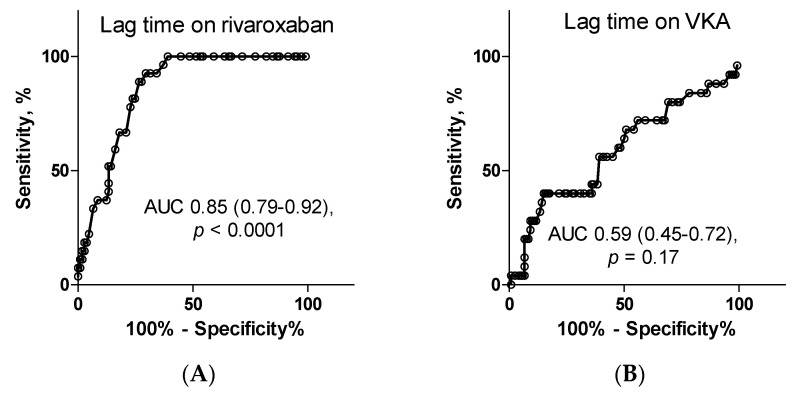
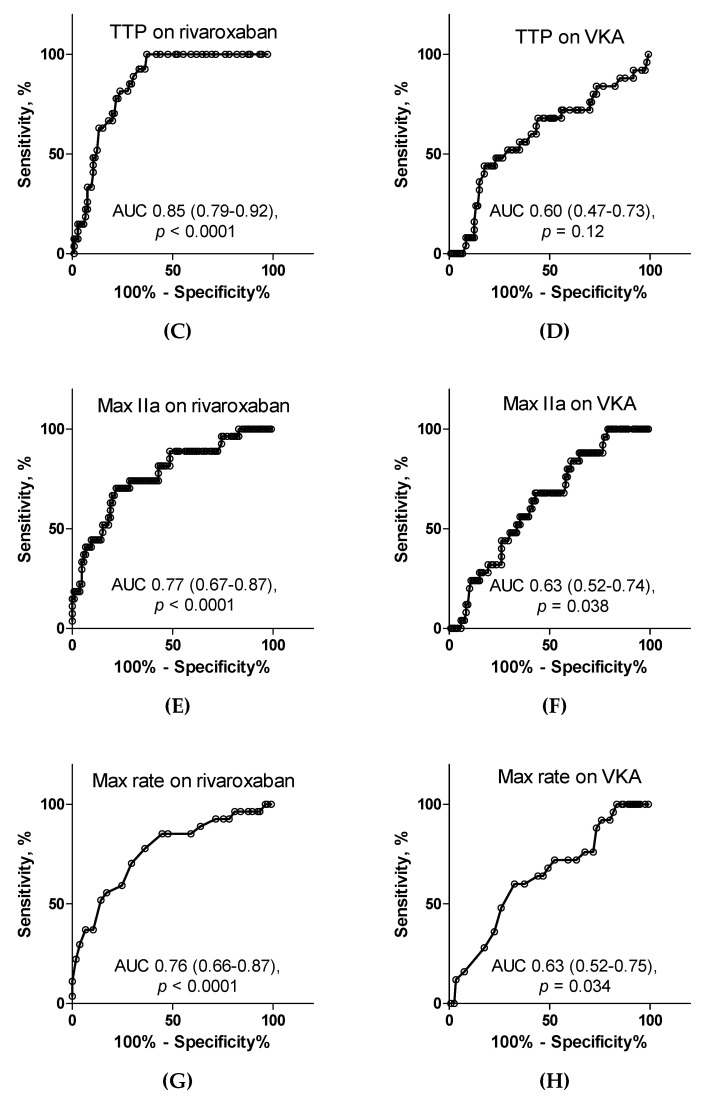
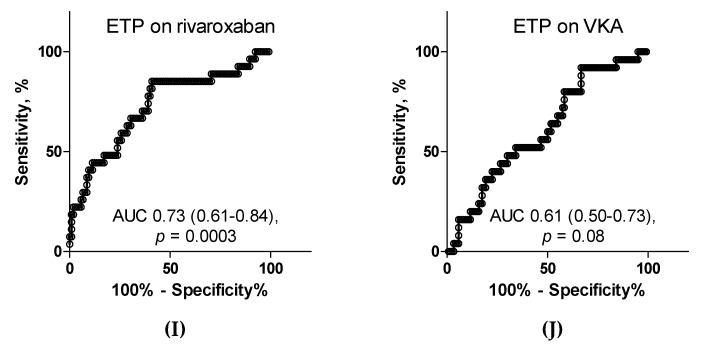
The receiver operating characteristics curves for calibrated automated thrombography parameters in prediction of minor bleedings. In patients on rivaroxaban, the highest predictive value for minor bleedings had lag time (A), TTP (C), max IIa (E) and max rate (G) and moderate ETP (I). In patients on VKA, moderate predictive values reached max IIa (F) and max rate (H) whereas lag time (B), TTP (D) and ETP (J) had no predictive value. Abbreviations: AUC: area under the curve, VKA: vitamin K antagonist, lag time: time to start thrombin generation, TTP: time to peak thrombin generation, max IIa: peak thrombin generation, max rate: the highest rate of thrombin generation, ETP: endogenous thrombin potential.


