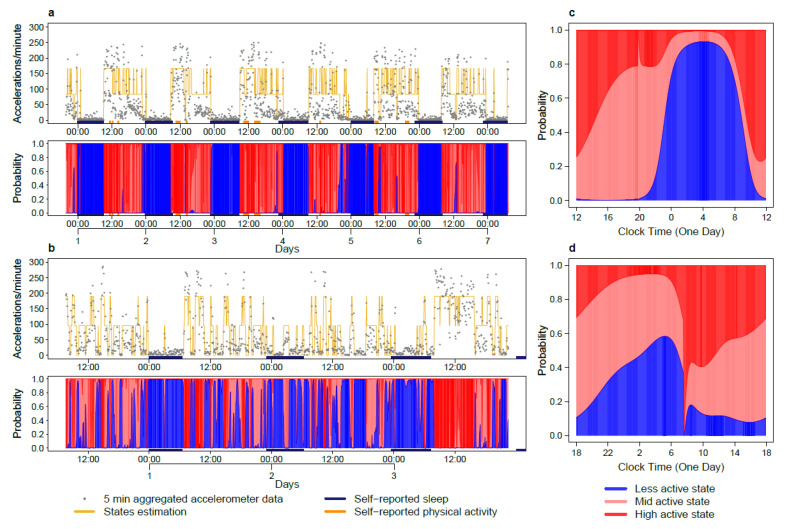
Figure 2.
Rest-activity states estimation. (a) Rest-activity plots of one patient in the (I < O)high group, with an I < O value of 99.1%. Top row: time series of rest-activity with yellow line indicating the most likely state using hidden Markov modelling (HMM) decoding. Bottom row: state probability plot showing the cumulative probabilities of low (blue), intermediate (pink) and high (red) active states. The color bars represent the patient’s self-reported sleeping and physical exercise spans. (b) Rest-activity plots of an example patient in the (I < O)low group, with an I < O value of 86.5%. (c) Circadian state probability plot from harmonic HMM of the rest-activity pattern of the patient shown in (a). The panel shows the periodic time profile of the three state probabilities plotted as a cumulative manner analogous to the state probability plot with same color coding as in the bottom row of (a). (d) Circadian state probability plot from harmonic HMM of the rest-activity pattern of the patient shown in (b).

