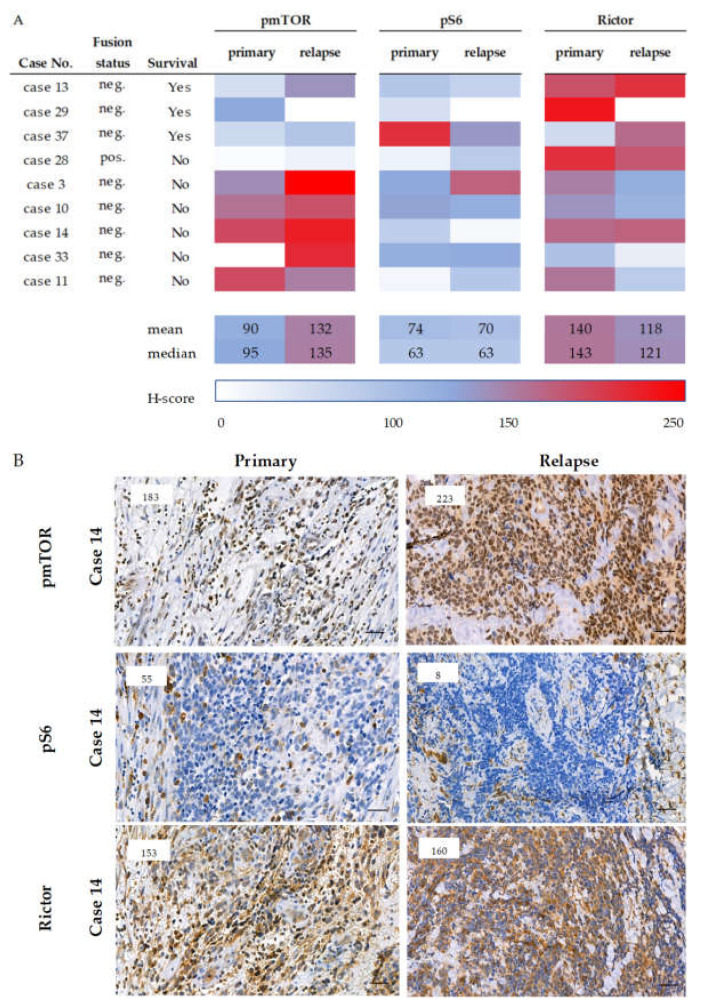
Figure 3.
Expression of mTOR markers in primary and relapse paired samples. mTOR-related marker expressions of the paired (primary and recurrent) cases are presented (panel (A)). The color scale represents the H-score in each case. Survival data and the fusion status are also given. Under the table (A), representative immunostainings of mTOR activity-related markers of primary and relapsed RMS cases are shown (panel (B)). DAB (brown) and hematoxylin were used as chromogen and counterstaining, respectively. The numbers in the left upper corner of the pictures refer to the given H-scores. Pictures were taken with CaseViewer 2.3 software (3DHistech Ltd., Budapest, Hungary. The scale bars show 25

