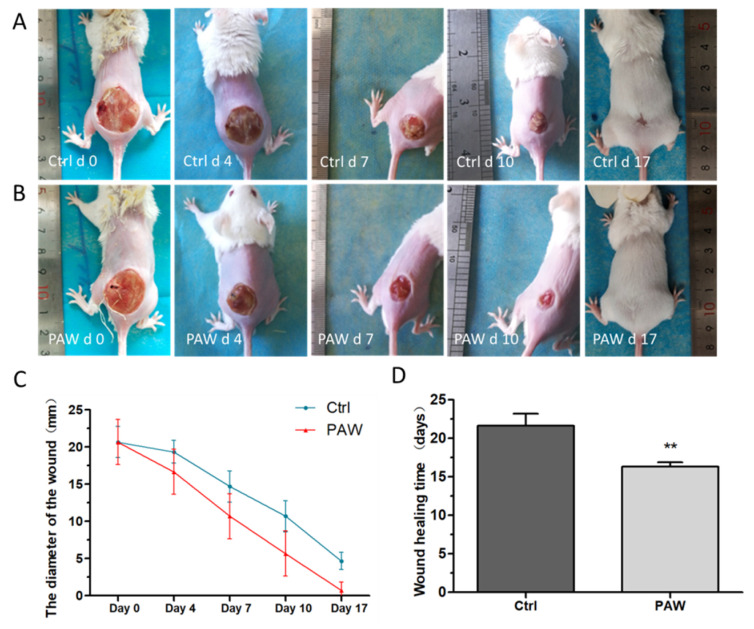
Figure 5.
Photographs of the wound healing process. Photographs of the mice wounds were captured at different time points (days 0, 4, 7, 10, and 17) for (A) the PAW treatment group and (B) the control group. (C) The results of the statistical analysis of wound diameters of mice in the treatment group (red lines) and the control group (blue lines) on days 0, 4, 7, 10, and 17. (D) The results of the analysis of the time required for the wounds to completely heal in the two groups of mice. Data are expressed as the mean ± SD, n = 5; **p < 0.01 (Student’s t-test).

