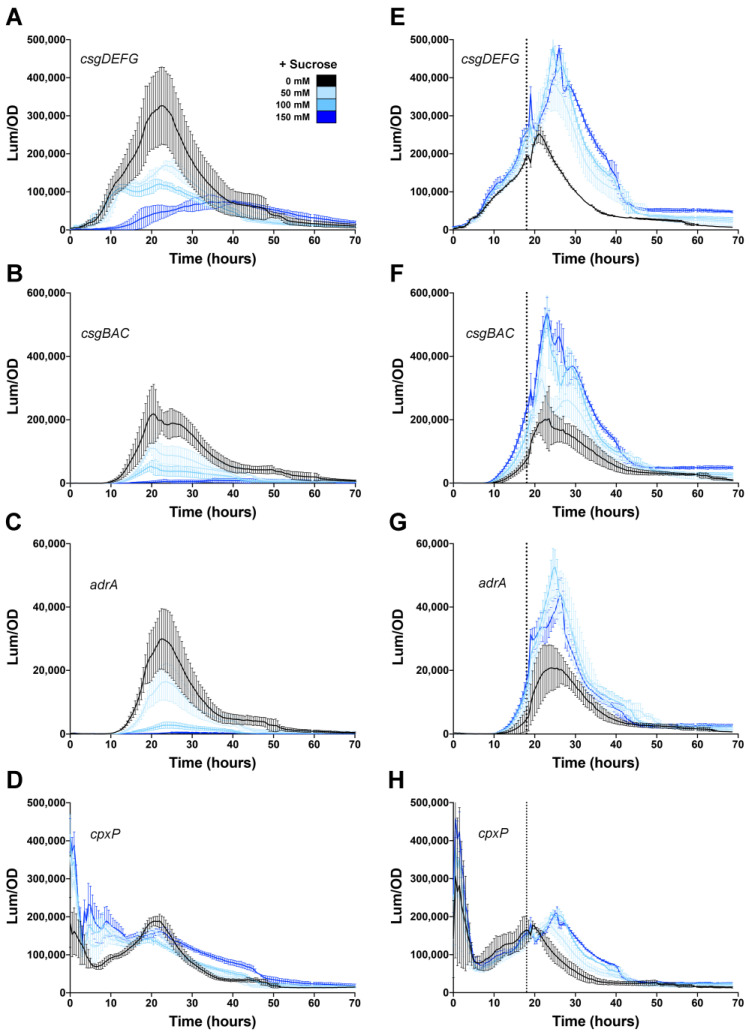
Figure 3.
Effect of sucrose addition on the Salmonella csgD regulatory network. Expression of csgDEFG (A,E), csgBAC (B,F), adrA (C,G), and cpxP (D,H) operons was measured during growth of S. typhimurium 14028 at 28 °C in media premixed with 50, 100 or 150 mM sucrose (A–D) or with sucrose added during growth (E–H; vertical line represents the time of addition at 18 h). For each graph, luminescence (light counts per second) divided by the optical density at 600 nm (Lum/OD) is plotted as a function of time and each curve represents a single growth condition. The mean and standard deviations are plotted from three biological replicate experiments measured in triplicate.

