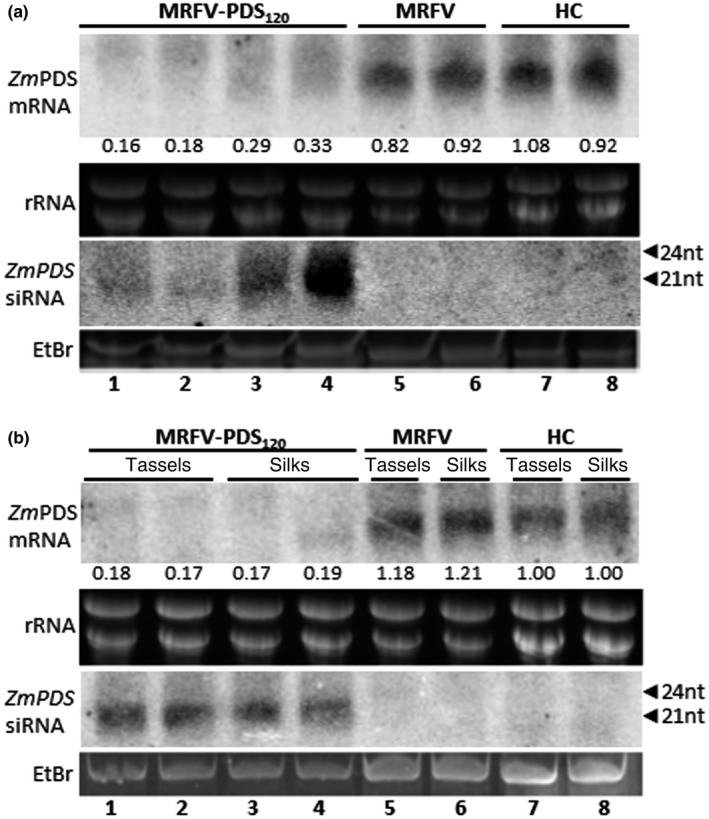
FIGURE 3.

Northern blot analysis of photobleaching phenotype induced by MRFV‐PDS120. High and low molecular weight RNA blots were hybridized with PDS‐specific RNA probes to respectively detect PDS mRNAs or antisense siRNAs in RNA samples isolated from leaves 30 dpi (a), and from tassels and silks 60 dpi (b). For loading controls, rRNA and the major RNA species in low molecular weight RNA were ethidium bromide (EtBr)‐stained prior to blotting of gels onto membrane. The positions of 21‐ to 24‐nucleotide RNA size markers are indicated by arrowheads. (a) Levels of PDS mRNA and siRNAs from MRFV‐PDS120‐infected leaves is shown (lanes 1–4) compared to MRFV‐infected (lanes 5–6) and healthy plants (lanes 7–8). The relative level of PDS mRNA (determined using ImageQuant) is indicated for each sample normalized against the average of the two healthy control samples set at 1.00. (b) Levels of PDS mRNA and siRNAs from MRFV‐PDS120‐infected tassels is shown (lanes 1–2) compared to MRFV‐infected (Lane 5) and healthy tassels (Lane 7). Levels of PDS mRNA and siRNAs from MRFV‐PDS120‐infected silks are shown (lanes 3–4) compared to MRFV‐infected (Lane 6) and healthy silks (Lane 8). The relative levels of PDS mRNA were determined as described in (a), with band intensity values of healthy tassels (Lane 7) and silks (Lane 8) independently designated as 1.00 and samples from respective tissues normalized against these controls
