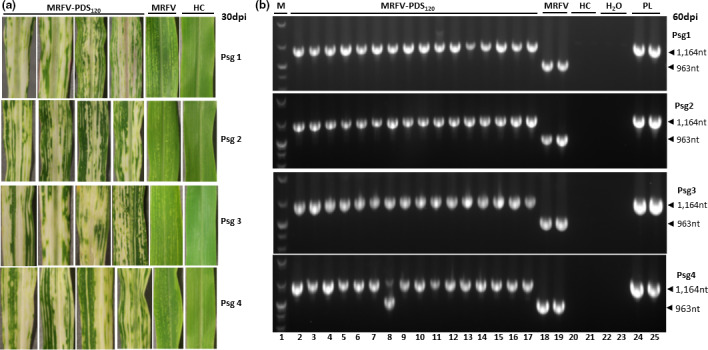
FIGURE 4.

Testing of the stability of MRFV‐PDS120 using serial passage inoculations with crude plant sap. (a) MRFV‐PDS120 symptoms and chlorophyll photobleaching phenotype at 30 dpi for each passage, compared to MRFV‐WT and noninoculated plants (HC). (b) RT‐PCR analysis (primers sm151 and sm152) of the integrity of MRFV‐PDS120 at each of the four passages. All the MRFV‐PDS120‐infected plants obtained for each passage were RT‐PCR assayed both at 15 dpi (not shown) and at 60 dpi (representative gel shown here). Healthy plants (HC) and water (H2O) were included as negative controls, and MRFV‐PDS120 plasmid (PL) as a positive control. M: 100 bp DNA marker.
