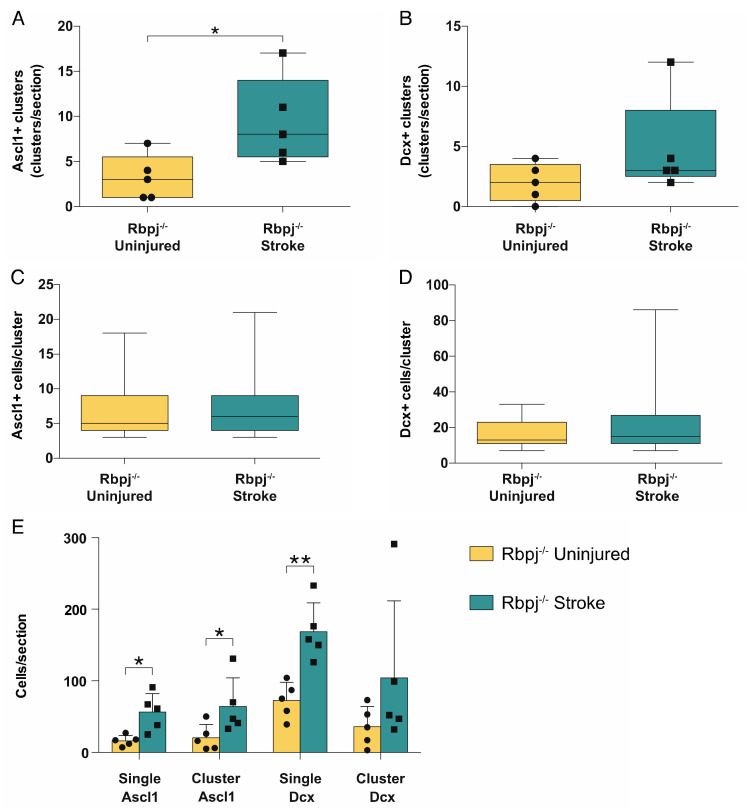
Figure 3.
Analysis of cluster number and size. Analysis of the Ascl+ and Dcx+ clusters in the stroke side compared to the uninjured striatum: (A,B) Quantification of the total number of clusters. Groups of Ascl1+ cells have been defined as clusters only when found in contact with each other and in numbers ≥3 cells; Dcx+ cells had to be in groups ≥7 to be considered a cluster. The number of Ascl1+ clusters was significantly higher in the stroke side compared to the uninjured striatum (p = 0.014); (C,D) Analysis of the size of Ascl1+ and Dcx+ cells in the stroke and uninjured striatum; (E) Analysis of the total number of cells found in clusters and as singlets. Ascl1+/Tomato+ cell numbers are increased both as single cells (p = 0.022) and in clusters (p = 0.023), while there is a significant increase only in the number of Dcx+/Tomato+ neuroblasts singlets (p = 0.0097). The data were analyzed using a paired t-test and are presented as mean ± SD.

