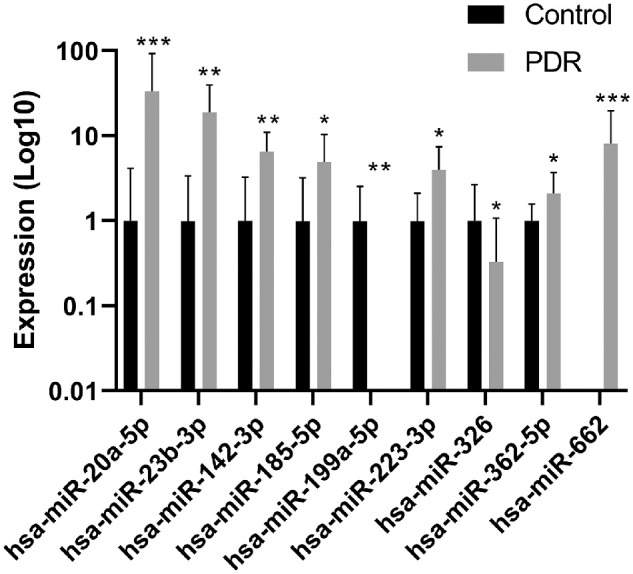
Figure 1.

Expression levels of miRNAs in the vitreous that were significantly different between control and PDR patients. The expression levels of miRNAs in the screening cohort consisted of control and PDR samples (control, n = 10; PDR, n = 10). The expression levels are shown as the means of absolute amounts with standard deviations as compared with controls on a log10 scale. The expression levels of hsa-miR-20a-5p, hsa-miR-23b-3p, hsa-miR-142-3p, hsa-miR-185-5p, hsa-miR-199a-5p, hsa-miR-223-3p, hsa-miR-326, and hsa-miR-362-5p are relative to the control group. The expression levels of hsa-miR-662 were calculated as absolute amounts (2−Ct × 1E12). *P < 0.05, **P < 0.01, and ***P < 0.001.
