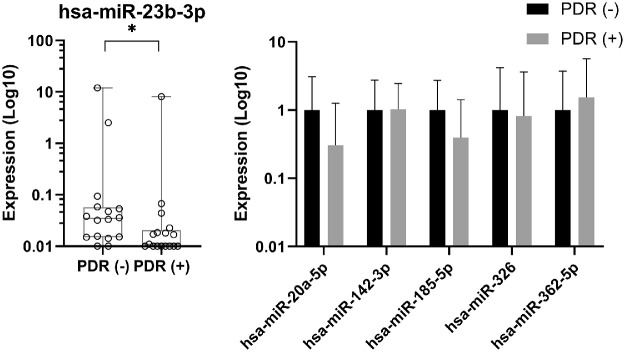
Figure 3.
Expression levels of miRNAs in the vitreous with and without anti-VEGF therapy. The expression levels of miRNAs were measured in the vitreous of patients with PDR who had not received anti-VEGF treatment, PDR(–) and in the vitreous of patients who had received anti-VEGF treatment, PDR(+). For hsa-miR-23b-3p, the expression levels are shown as absolute amounts on a log10 scale relative to the PDR(–) group. Box plots indicate median, minimum, and maximum and first and third quartiles. (A) The symbol on the x-axis represents one individual without detectable expression. (B) For hsa-miR-20a-5p, hsa-miR-142-3p, hsa-miR-185-5p, hsa-miR-326, and hsa-miR-362-5p, the expression levels are shown as the means of absolute amounts with standard deviations as compared with the PDR(–) group on a log10 scale. *P = 0.03.

