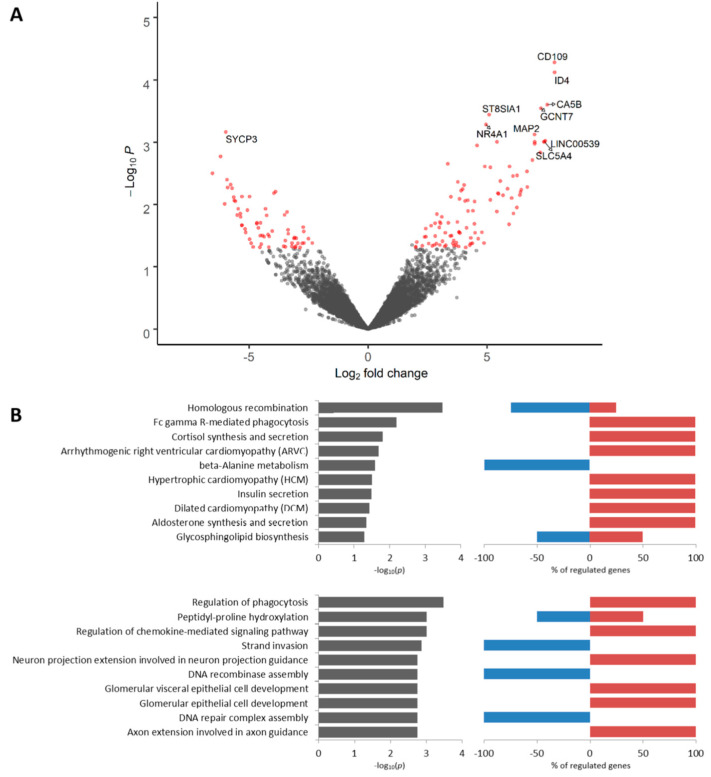
Figure 5.
Differential expression analysis of EZR-negative tumor cells. Volcano plot of TOP 10 up- and downregulated genes (A). TOP 10 KEGG signaling pathways and GO biological processes (B). Up- and downregulated genes with an unadjusted p-value < 0.05 were used for functional enrichment analysis. The left panel shows –log10p of the perturbation determined from a gene set test, whereas the right panel demonstrates a percentage of genes from corresponding KEGG and GO nodes that are down- and upregulated.

