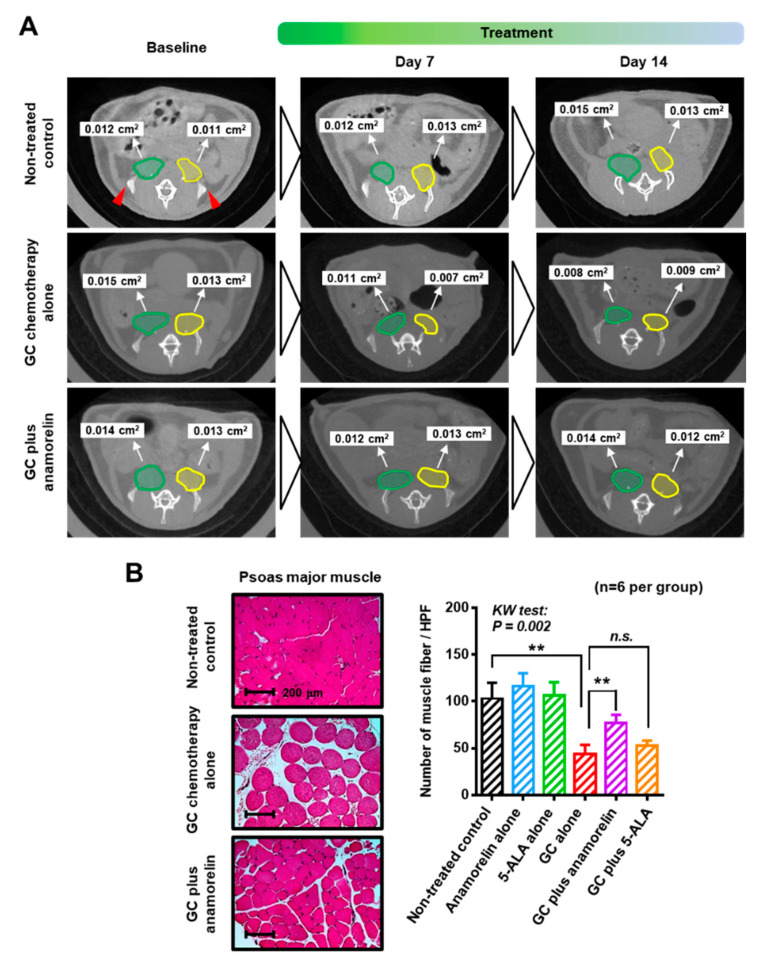
Figure 2.
Changes in skeletal muscles owing to chemotherapy. (A) Measurement of the cross-sectional area of the bilateral psoas major muscle at the level of the top of iliac bones (red triangles) was performed using a combination of computed tomography and NIH Image J. Right (green ellipse) and left (yellow ellipse) psoas major muscles were measured separately and summed. (B) Representative hematoxylin and eosin staining images are shown for the non-treated control, gemcitabine and cisplatin chemotherapy (GC) alone, and GC plus (continued) anamorelin groups. Original magnification: 200×. Quantifying HE-stained muscle mass was performed with Image J. The number of muscle fiber per high power field (HPF) was counted and compared among the treatment groups by the Kruskal-Wallis test and the post-hoc test (Dunn test). Abbreviations: 5-ALA—5-aminolevulinic acid; GC—gemcitabine and cisplatin combination chemotherapy; CT—computed tomography; HE—hematoxylin & eosin.

