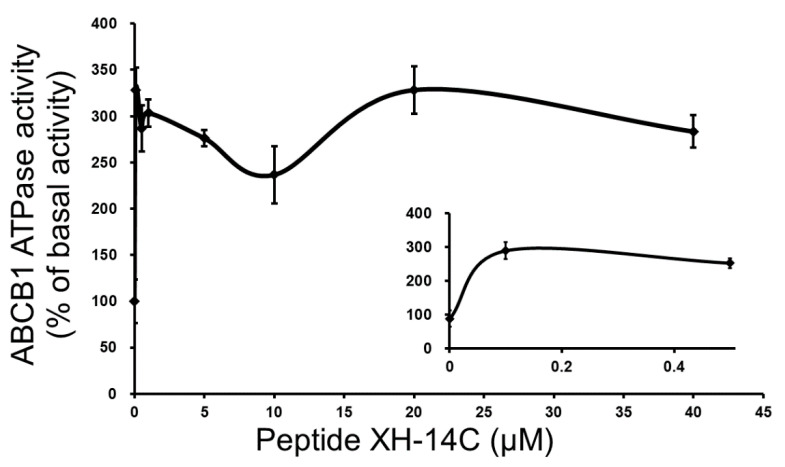
Figure 2.
The vanadate sensitive ABCB1 transporter specific ATPase activity was stimulated by XH-14C.Gradient concentration of XH-14C (0–40 μM) as x-axis and ABCB1 ATPase activity represented in percentage of basal activity as y-axis. The small inner figure shows the lower concentrations (0–0.5 μM) of XH-14C versus ATPase activity. The mean ± SD is demonstrated as the points with error bars calculated based on three independent experiments.

