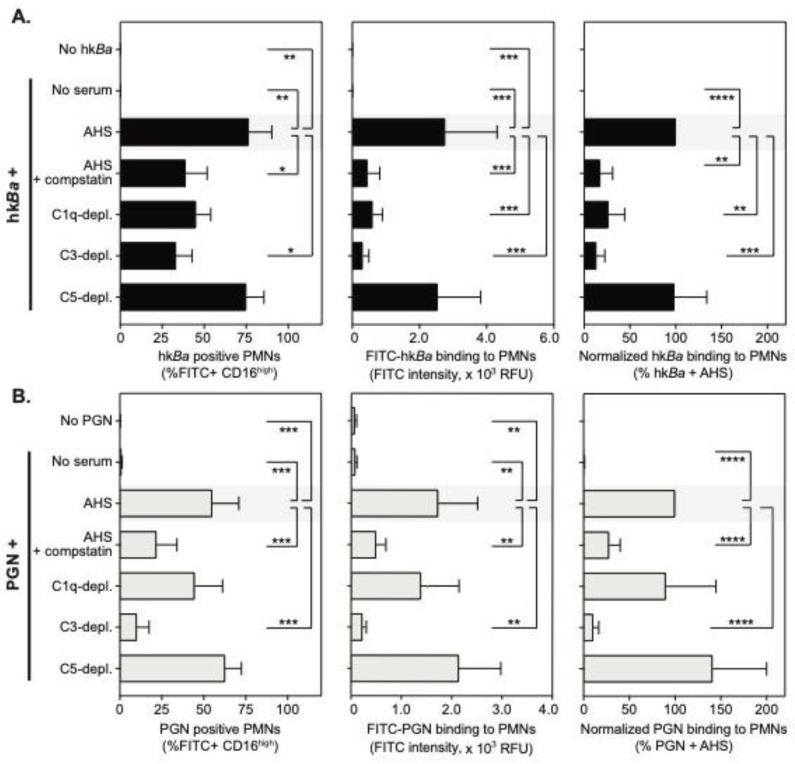
Figure 2.
Flow cytometry quantitation of FITC-hkBa (A) and/or the FITC-PGN (B) interaction with CD16high neutrophils in the presence of compstatin, a C3 convertase inhibitor, or the immunodepletion of complement factors. Data, shown as mean ± SD of 4–8 independent donors, depict bacteria or PGN positive PMNs (left panels), total bacteria or PGN uptake (geometric mean of fluorescence intensity, middle panels) and normalized changes in fluorescence intensity compared to bacteria or PGN uptake in the presence of autologous serum (AHS) that is considered 100% (right panels). For each panel, statistically significant differences compared to PAMPs + AHS (shaded) are depicted graphically (* p < 0.05; ** p < 0.01; *** p < 0.001; **** p < 0.0001) and were computed either by repeated measures one-way analysis of variance (ANOVA) with Holm–Sidak’s multiple comparisons test (left and middle panels), or by one sample t test compared to the normalized value (right panel).

