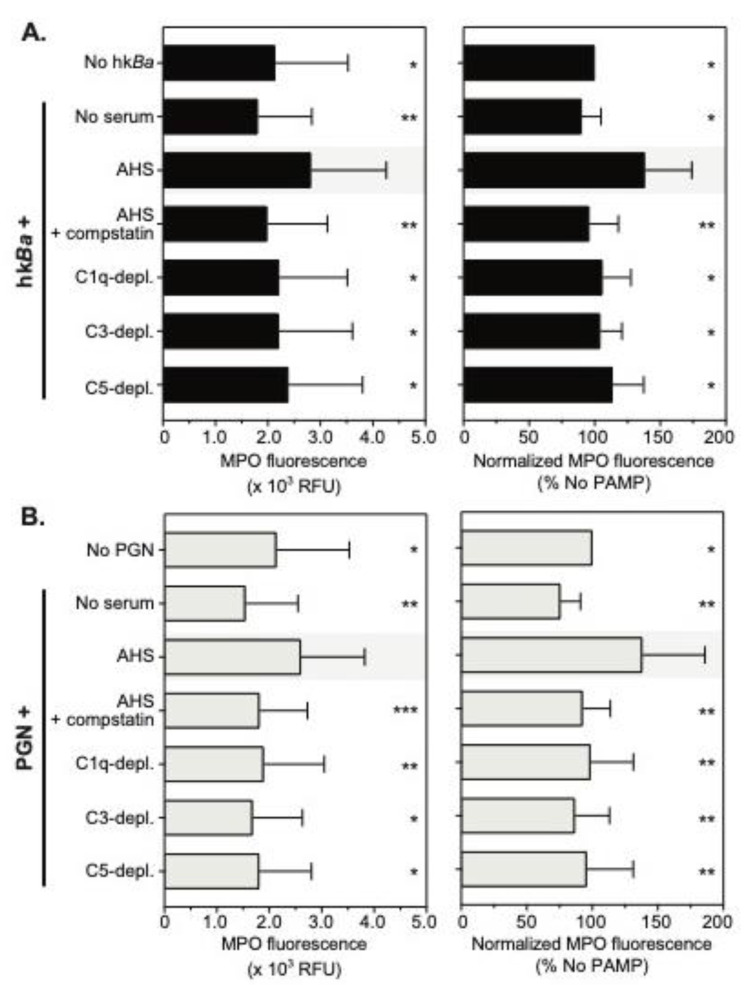
Figure 5.
Flow cytometry quantitation of myeloperoxidase (MPO) immunoreactivity in neutrophils stimulated with hkBa (A) or PGN (B) in the presence of compstatin, a C3 convertase inhibitor, or the immunodepletion of complement factors. Data are shown as mean ± SD of 10 independent donors and the depict intracellular MPO fluorescence (geometric mean) in CD16high neutrophils (left) or the changes in MPO fluorescence after paired normalization to control MPO immunoreactivity in the absence of agonists (right panel). Statistically significant differences compared to bacteria and/or PGN-induced MPO immunoreactivity in the presence of the autologous serum (AHS, shaded) are depicted graphically (* p < 0.05; ** p < 0.01; *** p < 0.001), and were computed by repeated measures one-way ANOVA with Holm–Sidak’s multiple comparisons tests.

